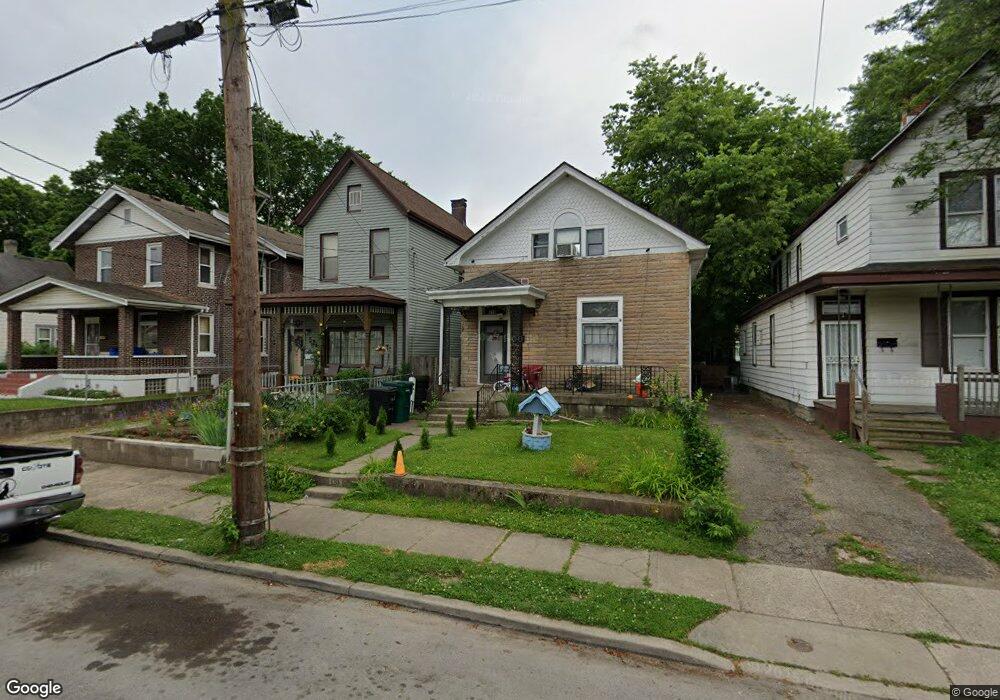
123 W Sixty Sixth St Cincinnati, OH 45216
Carthage NeighborhoodEstimated Value: $36,000 - $232,000
2
Beds
1
Bath
1,098
Sq Ft
$114/Sq Ft
Est. Value
About This Home
This home is located at 123 W Sixty Sixth St, Cincinnati, OH 45216 and is currently estimated at $124,831, approximately $113 per square foot. 123 W Sixty Sixth St is a home located in Hamilton County with nearby schools including Rising Stars at Carthage, Hartwell School, and Shroder High School.
Ownership History
Date
Name
Owned For
Owner Type
Purchase Details
Closed on
Nov 3, 2023
Sold by
Dighe Properties Llc
Bought by
Arf Properties Llc
Current Estimated Value
Purchase Details
Closed on
Oct 31, 2023
Sold by
Lawson Leonard Michael
Bought by
Dighe Properties Llc
Purchase Details
Closed on
Oct 27, 2023
Sold by
Eaton Mary Ada Renee
Bought by
Lawson Leonard Michael
Purchase Details
Closed on
Jan 8, 2015
Sold by
Lawson Pyhllis June
Bought by
Lawson Leonard Michael
Purchase Details
Closed on
Oct 13, 2010
Sold by
Eaton Mary Ada Renee
Bought by
Lawson Pyllis June
Purchase Details
Closed on
Aug 8, 2010
Sold by
Cissell Irene V
Bought by
Eaton Mary Ada Renee
Purchase Details
Closed on
Oct 7, 2004
Sold by
Turner Brenda S and Turner Brenda
Bought by
Turner Michael L
Create a Home Valuation Report for This Property
The Home Valuation Report is an in-depth analysis detailing your home's value as well as a comparison with similar homes in the area
Home Values in the Area
Average Home Value in this Area
Purchase History
We collect this data history from publicly available records. To have your information removed, we recommend requesting removal directly through your county’s website.
| Date | Buyer | Sale Price | Title Company |
|---|---|---|---|
| Arf Properties Llc | $38,500 | None Listed On Document | |
| Dighe Properties Llc | $25,000 | None Listed On Document | |
| Dighe Properties Llc | $25,000 | None Listed On Document | |
| Lawson Leonard Michael | -- | None Listed On Document | |
| Lawson Leonard Michael | -- | None Listed On Document | |
| Lawson Leonard Michael | -- | None Listed On Document | |
| Lawson Leonard Michael | -- | None Listed On Document | |
| Lawson Leonard Michael | -- | Attorney | |
| Lawson Pyllis June | -- | None Available | |
| Eaton Mary Ada Renee | $56,450 | Attorney | |
| Turner Michael L | -- | None Available |
Source: Public Records
Tax History
| Year | Tax Paid | Tax Assessment Tax Assessment Total Assessment is a certain percentage of the fair market value that is determined by local assessors to be the total taxable value of land and additions on the property. | Land | Improvement |
|---|---|---|---|---|
| 2025 | $1,223 | $19,177 | $6,689 | $12,488 |
| 2024 | $1,221 | $19,177 | $6,689 | $12,488 |
| 2023 | $1,224 | $19,177 | $6,689 | $12,488 |
| 2022 | $826 | $11,603 | $3,581 | $8,022 |
| 2021 | $809 | $11,603 | $3,581 | $8,022 |
| 2020 | $811 | $11,603 | $3,581 | $8,022 |
| 2019 | $769 | $10,003 | $3,087 | $6,916 |
| 2018 | $770 | $10,003 | $3,087 | $6,916 |
| 2017 | $741 | $10,003 | $3,087 | $6,916 |
| 2016 | $868 | $11,435 | $4,116 | $7,319 |
| 2015 | $776 | $11,435 | $4,116 | $7,319 |
| 2014 | $780 | $11,435 | $4,116 | $7,319 |
| 2013 | $793 | $11,435 | $4,116 | $7,319 |
Source: Public Records
Map
Nearby Homes
- 107 W Sixty Fifth St
- 6704 Van Kirk Ave
- 121 64th St
- 6312 Highland Ave
- 524 Maple St
- 206 W 69th St
- 528 Linden St
- 6011 Vine St
- 1 Spruce St
- 5906 Highland Ave
- 412 Lombardy St
- 6146 Cedar Ave
- 106 Township Ave
- 14 Township Ave
- 0 Township Road 111
- 14 W Seventy Third St
- 1139 Towanda Terrace
- 130 Nansen St
- 1205 Ryland Ave
- 1117 Regent Ave
- 121 W 66th St
- 119 W 66th St
- 125 W 66th St
- 127 W 66th St
- 117 W Sixty Sixth St
- 129 W 66th St
- 115 W 66th St
- 131 W 66th St
- 131 W Sixty Sixth St
- 113 W 66th St
- 122 W 65th St
- 120 W 65th St
- 124 W 65th St
- 140 W 66th St
- 122 W 65th St
- 133 W 66th St
- 144 W 66th St
- 130 W Sixty Sixth St
- 111 W 66th St
- 128 W Sixty Fifth St
Your Personal Tour Guide
Ask me questions while you tour the home.