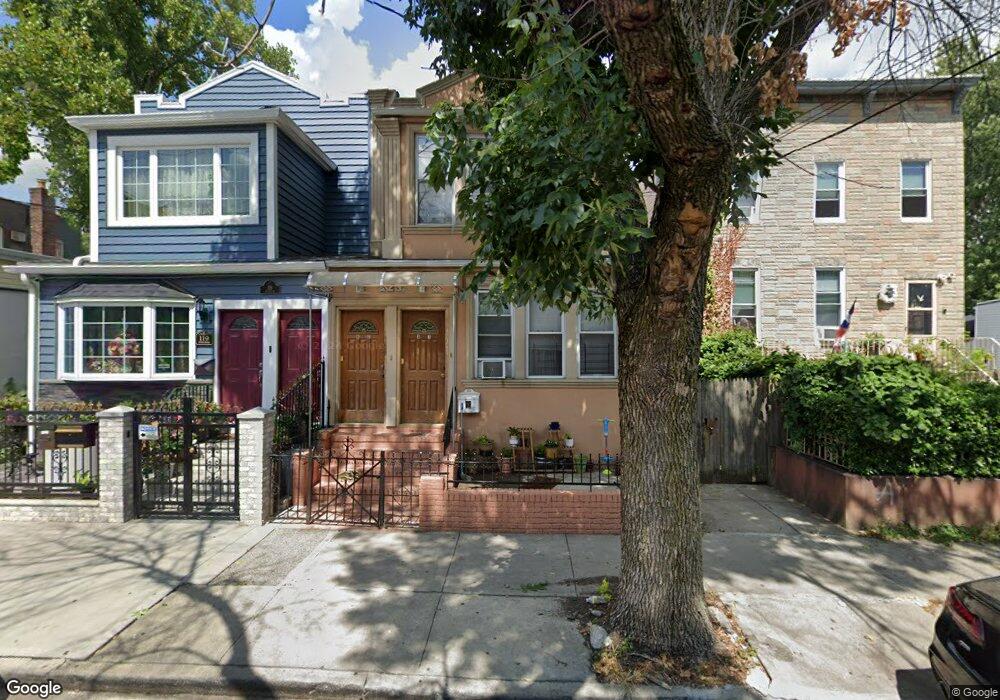
123 Weldon St Brooklyn, NY 11208
East New York NeighborhoodEstimated Value: $682,274 - $967,000
Studio
--
Bath
1,944
Sq Ft
$456/Sq Ft
Est. Value
About This Home
This home is located at 123 Weldon St, Brooklyn, NY 11208 and is currently estimated at $886,569, approximately $456 per square foot. 123 Weldon St is a home located in Kings County with nearby schools including P.S. 214 - Michael Friedsam, Cypress Hills Ascend Charter Lower School, and Blessed Sacrament School.
Ownership History
Date
Name
Owned For
Owner Type
Purchase Details
Closed on
Apr 26, 2005
Sold by
Hand Allen
Bought by
Balkissoon Lakhan
Current Estimated Value
Home Financials for this Owner
Home Financials are based on the most recent Mortgage that was taken out on this home.
Original Mortgage
$66,000
Outstanding Balance
$33,298
Interest Rate
6.05%
Estimated Equity
$853,271
Purchase Details
Closed on
May 31, 2000
Sold by
Better Homes Depot Inc
Bought by
Hand Allen
Home Financials for this Owner
Home Financials are based on the most recent Mortgage that was taken out on this home.
Original Mortgage
$250,778
Interest Rate
8.28%
Mortgage Type
FHA
Purchase Details
Closed on
Jan 29, 1999
Sold by
Dawah Johnny
Bought by
Better Homes
Create a Home Valuation Report for This Property
The Home Valuation Report is an in-depth analysis detailing your home's value as well as a comparison with similar homes in the area
Home Values in the Area
Average Home Value in this Area
Purchase History
We collect this data history from publicly available records. To have your information removed, we recommend requesting removal directly through your county’s website.
| Date | Buyer | Sale Price | Title Company |
|---|---|---|---|
| Balkissoon Lakhan | $440,000 | -- | |
| Balkissoon Lakhan | $440,000 | -- | |
| Hand Allen | $255,000 | Commonwealth Land Title Ins | |
| Hand Allen | $255,000 | Commonwealth Land Title Ins | |
| Better Homes | $119,100 | -- | |
| Better Homes | $119,100 | -- |
Source: Public Records
Mortgage History
We collect this data history from publicly available records. To have your information removed, we recommend requesting removal directly through your county’s website.
| Date | Status | Borrower | Loan Amount |
|---|---|---|---|
| Open | Balkissoon Lakhan | $66,000 | |
| Closed | Balkissoon Lakhan | $66,000 | |
| Open | Balkissoon Lakhan | $330,000 | |
| Closed | Balkissoon Lakhan | $330,000 | |
| Previous Owner | Hand Allen | $250,778 |
Source: Public Records
Tax History
| Year | Tax Paid | Tax Assessment Tax Assessment Total Assessment is a certain percentage of the fair market value that is determined by local assessors to be the total taxable value of land and additions on the property. | Land | Improvement |
|---|---|---|---|---|
| 2026 | $6,175 | $52,140 | $13,680 | $38,460 |
| 2025 | $6,117 | $48,480 | $13,680 | $34,800 |
| 2024 | $6,117 | $49,860 | $13,680 | $36,180 |
| 2023 | $5,835 | $45,120 | $13,680 | $31,440 |
| 2022 | $5,414 | $44,100 | $13,680 | $30,420 |
| 2021 | $5,392 | $43,860 | $13,680 | $30,180 |
| 2020 | $2,680 | $41,280 | $13,680 | $27,600 |
| 2019 | $5,309 | $32,820 | $13,680 | $19,140 |
| 2018 | $4,881 | $23,943 | $9,284 | $14,659 |
| 2017 | $4,607 | $22,602 | $10,144 | $12,458 |
| 2016 | $4,268 | $21,349 | $9,814 | $11,535 |
| 2015 | $2,572 | $21,349 | $12,799 | $8,550 |
| 2014 | $2,572 | $21,150 | $11,078 | $10,072 |
Source: Public Records
Map
Nearby Homes
- 3412 Atlantic Ave
- 397 Crescent St
- 422 Autumn Ave
- 367 Lincoln Ave
- 61 Glen St
- 331 Lincoln Ave
- 294 Autumn Ave
- 266 Hemlock St
- 312 Nichols Ave
- 285 Lincoln Ave
- 350 Grant Ave
- 272 Nichols Ave
- 19 Doscher St
- 407 Eldert Ln
- 3440 Fulton St
- 3242 Fulton St
- 414 Chestnut St
- 296 Eldert Ln
- 3235 Fulton St
- 142 Forbell St
- 119 Weldon St
- 125 Weldon St
- 131 Weldon St
- 351 Crescent St
- 353 Crescent St
- 353 Crescent St Unit Building
- 355 Crescent St
- 345 Crescent St
- 134 Glen St
- 133 Weldon St
- 343 Crescent St
- 130 Glen St
- 136 Glen St
- 337 Crescent St
- 135 Weldon St
- 138 Glen St
- 335 Crescent St
- 112 Weldon St
- 122 Weldon St
- 122 Weldon St Unit 1Fl+Ba
Your Personal Tour Guide
Ask me questions while you tour the home.