Estimated Value: $63,000 - $121,000
4
Beds
2
Baths
724
Sq Ft
$117/Sq Ft
Est. Value
About This Home
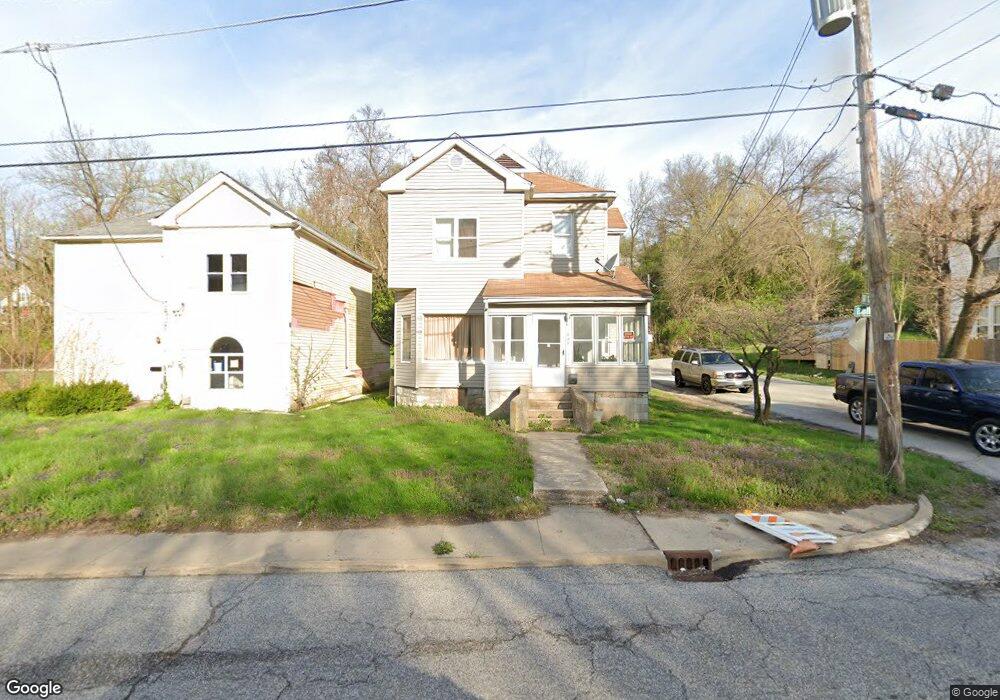
This home is located at 1230 Belle St, Alton, IL 62002 and is currently estimated at $84,621, approximately $116 per square foot. 1230 Belle St is a home located in Madison County with nearby schools including Gilson Brown Elementary School, Alton Middle School, and Alton High School.
Ownership History
Date
Name
Owned For
Owner Type
Purchase Details
Closed on
May 18, 2009
Sold by
Brown Keith
Bought by
Brown Keith
Current Estimated Value
Purchase Details
Closed on
Jun 4, 2003
Sold by
The Chase Manhattan Bank
Bought by
Brown Keith
Home Financials for this Owner
Home Financials are based on the most recent Mortgage that was taken out on this home.
Original Mortgage
$27,000
Interest Rate
7%
Mortgage Type
Purchase Money Mortgage
Purchase Details
Closed on
Mar 19, 2003
Sold by
Chatman Samuel J
Bought by
Fairbanks Capital Corp
Create a Home Valuation Report for This Property
The Home Valuation Report is an in-depth analysis detailing your home's value as well as a comparison with similar homes in the area
Home Values in the Area
Average Home Value in this Area
Purchase History
| Date | Buyer | Sale Price | Title Company |
|---|---|---|---|
| Brown Keith | -- | None Available | |
| Brown Keith | $27,000 | Chicago Title Insurance Co | |
| The Chase Manhattan Bank | -- | Chicago Title Insurance Co | |
| Fairbanks Capital Corp | -- | -- |
Source: Public Records
Mortgage History
| Date | Status | Borrower | Loan Amount |
|---|---|---|---|
| Closed | Brown Keith | $27,000 |
Source: Public Records
Tax History Compared to Growth
Tax History
| Year | Tax Paid | Tax Assessment Tax Assessment Total Assessment is a certain percentage of the fair market value that is determined by local assessors to be the total taxable value of land and additions on the property. | Land | Improvement |
|---|---|---|---|---|
| 2024 | $927 | $17,400 | $1,300 | $16,100 |
| 2023 | $927 | $15,710 | $1,170 | $14,540 |
| 2022 | $821 | $14,200 | $1,060 | $13,140 |
| 2021 | $673 | $13,350 | $1,000 | $12,350 |
| 2020 | $638 | $12,870 | $960 | $11,910 |
| 2019 | $646 | $12,580 | $940 | $11,640 |
| 2018 | $614 | $12,260 | $920 | $11,340 |
| 2017 | $1,186 | $12,260 | $920 | $11,340 |
| 2016 | $594 | $12,260 | $920 | $11,340 |
| 2015 | $578 | $12,260 | $920 | $11,340 |
| 2014 | $578 | $12,260 | $920 | $11,340 |
| 2013 | $578 | $12,590 | $940 | $11,650 |
Source: Public Records
Map
Nearby Homes