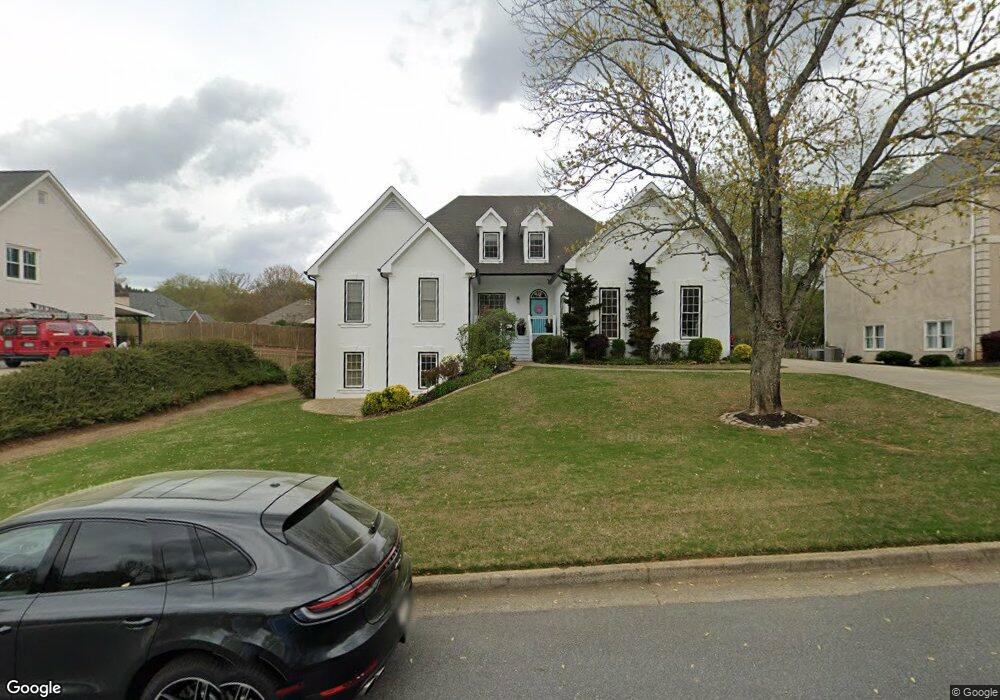
1230 Chelsey Ln Alpharetta, GA 30004
Estimated Value: $841,434 - $942,000
4
Beds
3
Baths
3,137
Sq Ft
$283/Sq Ft
Est. Value
About This Home
This home is located at 1230 Chelsey Ln, Alpharetta, GA 30004 and is currently estimated at $888,109, approximately $283 per square foot. 1230 Chelsey Ln is a home located in Fulton County with nearby schools including Crabapple Crossing Elementary School, Northwestern Middle School, and Milton High School.
Ownership History
Date
Name
Owned For
Owner Type
Purchase Details
Closed on
Sep 3, 1998
Sold by
Klein Edward W
Bought by
Cosma Shirley M
Current Estimated Value
Home Financials for this Owner
Home Financials are based on the most recent Mortgage that was taken out on this home.
Original Mortgage
$43,050
Interest Rate
6.95%
Mortgage Type
Stand Alone Second
Purchase Details
Closed on
Oct 16, 1995
Sold by
Propsinc Torrance
Bought by
Cosma Shirley M
Purchase Details
Closed on
Mar 23, 1994
Sold by
Chelsey Dev Lp
Bought by
Torrance Props Inc
Home Financials for this Owner
Home Financials are based on the most recent Mortgage that was taken out on this home.
Original Mortgage
$28,000
Interest Rate
7.1%
Mortgage Type
Construction
Create a Home Valuation Report for This Property
The Home Valuation Report is an in-depth analysis detailing your home's value as well as a comparison with similar homes in the area
Home Values in the Area
Average Home Value in this Area
Purchase History
| Date | Buyer | Sale Price | Title Company |
|---|---|---|---|
| Cosma Shirley M | -- | -- | |
| Cosma Shirley M | $283,800 | -- | |
| Torrance Props Inc | $37,500 | -- |
Source: Public Records
Mortgage History
| Date | Status | Borrower | Loan Amount |
|---|---|---|---|
| Closed | Cosma Shirley M | $43,050 | |
| Previous Owner | Torrance Props Inc | $28,000 | |
| Closed | Torrance Props Inc | $9,500 | |
| Closed | Cosma Shirley M | $0 |
Source: Public Records
Tax History Compared to Growth
Tax History
| Year | Tax Paid | Tax Assessment Tax Assessment Total Assessment is a certain percentage of the fair market value that is determined by local assessors to be the total taxable value of land and additions on the property. | Land | Improvement |
|---|---|---|---|---|
| 2025 | $1,003 | $266,800 | $46,240 | $220,560 |
| 2023 | $7,664 | $271,520 | $46,240 | $225,280 |
| 2022 | $4,770 | $271,520 | $46,240 | $225,280 |
| 2021 | $5,617 | $202,160 | $36,880 | $165,280 |
| 2020 | $5,352 | $176,000 | $47,920 | $128,080 |
| 2019 | $819 | $176,000 | $47,920 | $128,080 |
| 2018 | $5,238 | $210,640 | $47,920 | $162,720 |
| 2017 | $5,099 | $174,760 | $35,720 | $139,040 |
| 2016 | $5,100 | $174,760 | $35,720 | $139,040 |
| 2015 | $6,126 | $174,760 | $35,720 | $139,040 |
| 2014 | $4,906 | $160,040 | $32,720 | $127,320 |
Source: Public Records
Map
Nearby Homes
- 12455 Pindell Cir
- 1360 Bethany Ct
- 1050 Little River Ln
- 1065 Mid Broadwell Rd
- 175 Heatherton Ln
- 785 Briars Bend
- 145 Pruitt Dr
- 7412 Mid Broadwell Trace
- 7411 Mid Broadwell Trace
- 1395 Mid Broadwell Rd
- 245 Heatherton Way
- 1500 Mid Broadwell Rd
- 275 Heatherton Way
- 12350 Charlotte Dr
- 1645 Mayfield Rd
- 2200 Cortland Rd
- 1510 Shade Tree Way
- 1580 Mayfield Rd
- 13039 Freemanville Rd
- 1240 Chelsey Ln
- 1220 Chelsey Ln
- 1235 Tuscany Ct
- 1225 Tuscany Ct
- 1235 Chelsey Ln
- 1210 Chelsey Ln
- 1250 Chelsey Ln
- 1245 Tuscany Ct
- 1215 Tuscany Ct
- 105 Brighton Cir
- 210 Chelsey Cir
- 110 Brighton Cir
- 1200 Chelsey Ln
- 1260 Chelsey Ln
- 1255 Chelsey Ln
- 1205 Tuscany Ct
- 1240 Tuscany Ct
- 220 Chelsey Cir
- 1205 Chelsey Ln
- 1220 Tuscany Ct