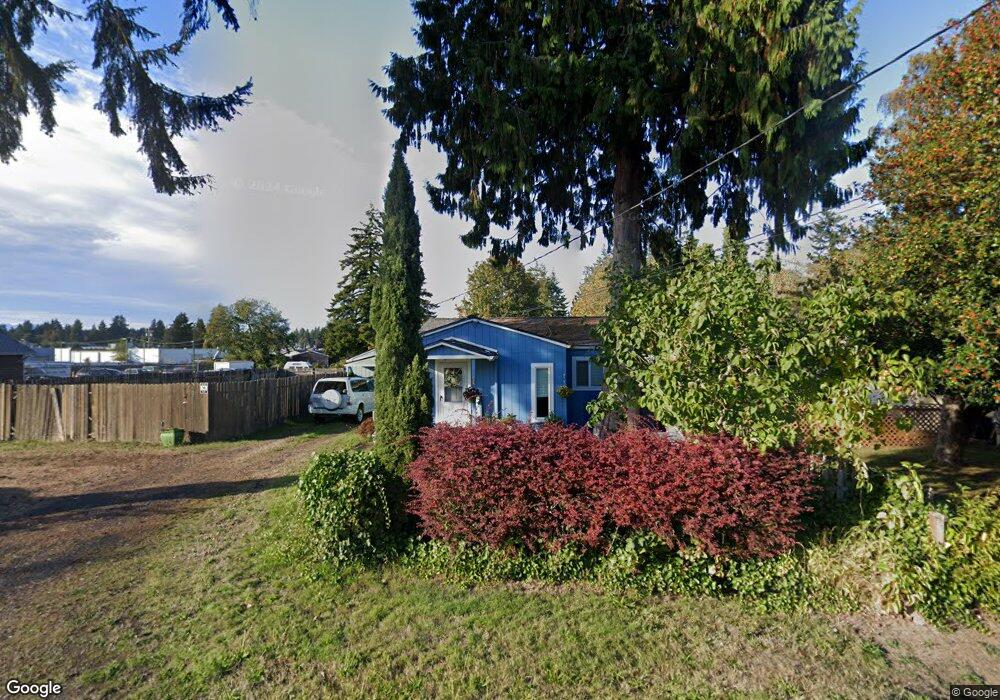
1230 Ivy Rd Bremerton, WA 98310
Estimated Value: $356,751 - $409,000
2
Beds
1
Bath
1,122
Sq Ft
$346/Sq Ft
Est. Value
About This Home
This home is located at 1230 Ivy Rd, Bremerton, WA 98310 and is currently estimated at $388,688, approximately $346 per square foot. 1230 Ivy Rd is a home located in Kitsap County with nearby schools including View Ridge Elementary School, Mountain View Middle School, and Bremerton High School.
Ownership History
Date
Name
Owned For
Owner Type
Purchase Details
Closed on
Nov 3, 2009
Sold by
Yohey Barbara J and Wickman Barbara J
Bought by
Yohey Lyle L and Yohey Barbara J
Current Estimated Value
Home Financials for this Owner
Home Financials are based on the most recent Mortgage that was taken out on this home.
Original Mortgage
$255,000
Outstanding Balance
$166,675
Interest Rate
5.02%
Mortgage Type
Reverse Mortgage Home Equity Conversion Mortgage
Estimated Equity
$222,013
Purchase Details
Closed on
Feb 20, 1997
Sold by
Neal Charles A and Neal Carolyn F
Bought by
Wickman Barbara J and Lindegren Leona Elizabeth
Home Financials for this Owner
Home Financials are based on the most recent Mortgage that was taken out on this home.
Original Mortgage
$62,679
Interest Rate
7.85%
Mortgage Type
FHA
Create a Home Valuation Report for This Property
The Home Valuation Report is an in-depth analysis detailing your home's value as well as a comparison with similar homes in the area
Home Values in the Area
Average Home Value in this Area
Purchase History
| Date | Buyer | Sale Price | Title Company |
|---|---|---|---|
| Yohey Lyle L | -- | Land Title | |
| Wickman Barbara J | $64,000 | Land Title Co |
Source: Public Records
Mortgage History
| Date | Status | Borrower | Loan Amount |
|---|---|---|---|
| Open | Yohey Lyle L | $255,000 | |
| Closed | Wickman Barbara J | $62,679 |
Source: Public Records
Tax History Compared to Growth
Tax History
| Year | Tax Paid | Tax Assessment Tax Assessment Total Assessment is a certain percentage of the fair market value that is determined by local assessors to be the total taxable value of land and additions on the property. | Land | Improvement |
|---|---|---|---|---|
| 2026 | $304 | $285,930 | $96,240 | $189,690 |
| 2025 | $304 | $285,930 | $96,240 | $189,690 |
| 2024 | $287 | $285,930 | $96,240 | $189,690 |
| 2023 | $297 | $285,930 | $96,240 | $189,690 |
| 2022 | $339 | $239,590 | $80,200 | $159,390 |
| 2021 | $369 | $213,380 | $53,550 | $159,830 |
| 2020 | $382 | $199,820 | $49,930 | $149,890 |
| 2019 | $390 | $180,680 | $44,860 | $135,820 |
| 2018 | $400 | $134,000 | $36,180 | $97,820 |
| 2017 | $381 | $134,000 | $36,180 | $97,820 |
| 2016 | $367 | $118,720 | $31,740 | $86,980 |
| 2015 | $343 | $111,080 | $32,150 | $78,930 |
| 2014 | -- | $106,970 | $32,150 | $74,820 |
| 2013 | -- | $114,010 | $34,400 | $79,610 |
Source: Public Records
Map
Nearby Homes
- 1312 E Hope St
- 3621 Wheaton Way
- 937 Pearl St
- 802 Hanford Ave
- 4209 Westview Dr NE
- 3525 Harbel Dr NE
- 704 NE Normandy Dr
- 638 Shirehill St
- 1802 NE Windermere Dr
- 1800 NE Riddell Rd
- 3835 Earendale Ave
- 920 E 31st St
- 3001 Wheaton Way
- 3715 Perry Ave NE
- 2916 Robin Ave
- 944 E 30th St
- 3868 Pinecone Dr NE
- 2824 Robin Ave
- 654 E 31st St
- 1413 Lindberg Place
- 1238 Ivy Rd
- 1246 Ivy Rd
- 1231 Ivy Rd
- 1225 Ivy Rd
- 1237 Ivy Rd
- 1248 Ivy Rd
- 1219 Ivy Rd
- 3805 Maple Ave
- 3805 Maple Ave
- 1243 Ivy Rd
- 3809 Maple Ave
- 3809 3811 Maple Ave
- 3890 2624 N 21st St Way
- 3815 Maple Ave
- 1249 Ivy Rd
- 3900 Wheaton Way
- 3813 3815 Maple Ave
- 3831 Maple Ave
- 3835 Maple Ave
- 3827 Maple Ave Unit B