C
Seller's Agent in 2014
Camille Taylor
Century 21 Smith Branch & Pope
Estimated Value: $141,385 - $228,000
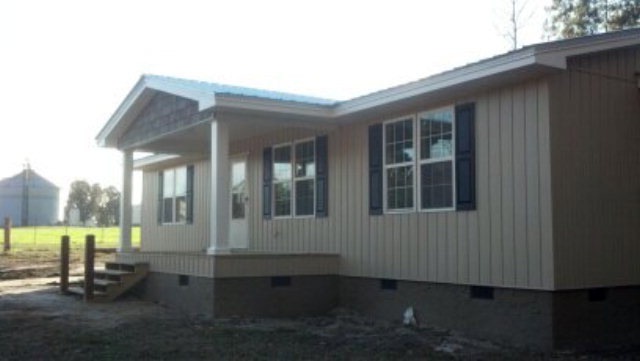
This 3/2 home has been updated to include heart pine flooring throughout, new windows, new cabinets and countertops, new appliances and a new deck to enjoy as you watch the sunset over the adjoining farm in a rural setting.
Last Agent to Sell the Property
Camille Taylor
Century 21 Smith Branch & Pope Brokerage Phone: 2293868737 License #298311 Listed on: 03/07/2014
Last Buyer's Agent
Camille Taylor
Century 21 Smith Branch & Pope Brokerage Phone: 2293868737 License #298311 Listed on: 03/07/2014
| Date | Buyer | Sale Price | Title Company |
|---|---|---|---|
| Semrau Justin D | $113,000 | -- | |
| Kretzer Jodie J | $95,000 | -- | |
| Acord V David | $18,000 | -- | |
| Eascom Donnie B | -- | -- |
| Date | Status | Borrower | Loan Amount |
|---|---|---|---|
| Open | Semrau Justin D | $114,141 | |
| Previous Owner | Kretzer Jodie J | $96,938 |
| Date | Event | Price | List to Sale | Price per Sq Ft | Prior Sale |
|---|---|---|---|---|---|
| 03/14/2014 03/14/14 | Sold | $95,000 | +427.8% | $76 / Sq Ft | |
| 03/07/2014 03/07/14 | Pending | -- | -- | -- | |
| 10/18/2013 10/18/13 | Sold | $18,000 | -- | $16 / Sq Ft | View Prior Sale |
| 09/17/2013 09/17/13 | Pending | -- | -- | -- |
| Year | Tax Paid | Tax Assessment Tax Assessment Total Assessment is a certain percentage of the fair market value that is determined by local assessors to be the total taxable value of land and additions on the property. | Land | Improvement |
|---|---|---|---|---|
| 2024 | $938 | $23,586 | $4,000 | $19,586 |
| 2023 | $938 | $23,586 | $4,000 | $19,586 |
| 2022 | $912 | $22,676 | $4,000 | $18,676 |
| 2021 | $889 | $22,676 | $4,000 | $18,676 |
| 2020 | $890 | $22,676 | $4,000 | $18,676 |
| 2019 | $834 | $22,676 | $4,000 | $18,676 |
| 2018 | $650 | $22,676 | $4,000 | $18,676 |
| 2017 | $650 | $22,676 | $4,000 | $18,676 |
| 2016 | $594 | $22,676 | $4,000 | $18,676 |
| 2015 | $595 | $22,676 | $4,000 | $18,676 |
| 2014 | $651 | $22,676 | $4,000 | $18,676 |
| 2013 | -- | $21,476 | $2,800 | $18,676 |
| 2012 | -- | $21,475 | $2,800 | $18,675 |
C
Seller's Agent in 2014
Camille Taylor
Century 21 Smith Branch & Pope
A
Seller's Agent in 2013
Alice Jolley
Coldwell Banker Walden & Kirkland
Source: Albany Board of REALTORS®
MLS Number: 130521
APN: 00610-007-00A
