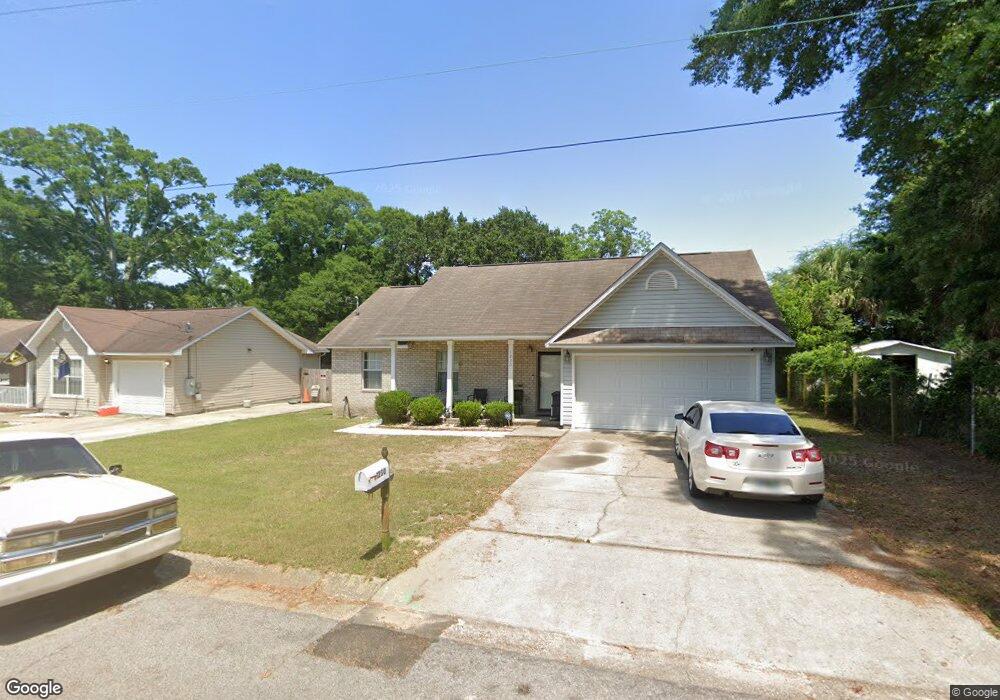
1230 N H St Pensacola, FL 32501
Estimated Value: $216,301 - $287,000
--
Bed
--
Bath
1,266
Sq Ft
$196/Sq Ft
Est. Value
About This Home
This home is located at 1230 N H St, Pensacola, FL 32501 and is currently estimated at $247,575, approximately $195 per square foot. 1230 N H St is a home located in Escambia County with nearby schools including Warrington Middle School, Pensacola High School, and Escambia Christian School.
Ownership History
Date
Name
Owned For
Owner Type
Purchase Details
Closed on
Dec 23, 2008
Sold by
Commnunity Enterprises Investments Inc
Bought by
Mcpherson Angie
Current Estimated Value
Home Financials for this Owner
Home Financials are based on the most recent Mortgage that was taken out on this home.
Original Mortgage
$111,925
Outstanding Balance
$73,846
Interest Rate
6.1%
Mortgage Type
FHA
Estimated Equity
$173,729
Purchase Details
Closed on
Dec 21, 2005
Sold by
Goode H D
Bought by
City Of Pensacola
Create a Home Valuation Report for This Property
The Home Valuation Report is an in-depth analysis detailing your home's value as well as a comparison with similar homes in the area
Home Values in the Area
Average Home Value in this Area
Purchase History
| Date | Buyer | Sale Price | Title Company |
|---|---|---|---|
| Mcpherson Angie | $135,000 | Citizens Title Group Inc | |
| City Of Pensacola | -- | First American Title Ins Co |
Source: Public Records
Mortgage History
| Date | Status | Borrower | Loan Amount |
|---|---|---|---|
| Open | Mcpherson Angie | $111,925 |
Source: Public Records
Tax History Compared to Growth
Tax History
| Year | Tax Paid | Tax Assessment Tax Assessment Total Assessment is a certain percentage of the fair market value that is determined by local assessors to be the total taxable value of land and additions on the property. | Land | Improvement |
|---|---|---|---|---|
| 2024 | $838 | $89,916 | -- | -- |
| 2023 | $838 | $87,298 | $0 | $0 |
| 2022 | $803 | $84,756 | $0 | $0 |
| 2021 | $781 | $82,288 | $0 | $0 |
| 2020 | $757 | $81,152 | $0 | $0 |
| 2019 | $732 | $79,328 | $0 | $0 |
| 2018 | $721 | $77,849 | $0 | $0 |
| 2017 | $709 | $76,248 | $0 | $0 |
| 2016 | $696 | $74,680 | $0 | $0 |
| 2015 | $705 | $74,161 | $0 | $0 |
| 2014 | $707 | $73,573 | $0 | $0 |
Source: Public Records
Map
Nearby Homes