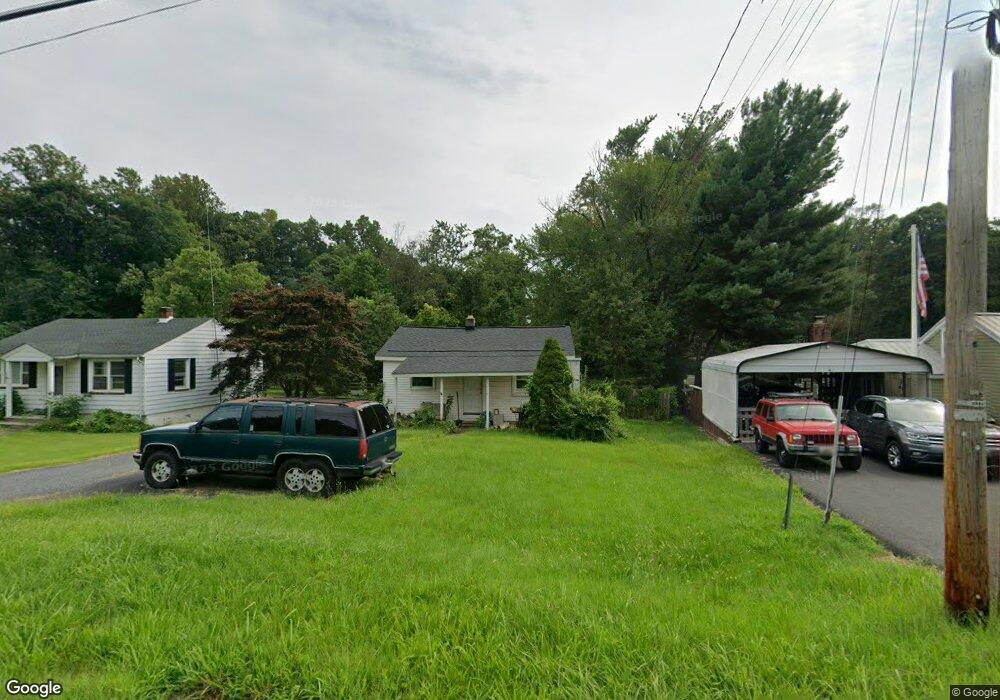
1230 Prospect Mill Rd Bel Air, MD 21015
Estimated Value: $222,906 - $298,000
--
Bed
1
Bath
624
Sq Ft
$389/Sq Ft
Est. Value
About This Home
This home is located at 1230 Prospect Mill Rd, Bel Air, MD 21015 and is currently estimated at $242,477, approximately $388 per square foot. 1230 Prospect Mill Rd is a home located in Harford County with nearby schools including Hickory Elementary School, Southampton Middle School, and C. Milton Wright High School.
Ownership History
Date
Name
Owned For
Owner Type
Purchase Details
Closed on
Jan 3, 2008
Sold by
Agee John D
Bought by
Agee John D
Current Estimated Value
Home Financials for this Owner
Home Financials are based on the most recent Mortgage that was taken out on this home.
Original Mortgage
$106,000
Outstanding Balance
$67,396
Interest Rate
6.3%
Mortgage Type
Purchase Money Mortgage
Estimated Equity
$175,081
Purchase Details
Closed on
Dec 6, 2007
Sold by
Agee John D
Bought by
Agee John D
Home Financials for this Owner
Home Financials are based on the most recent Mortgage that was taken out on this home.
Original Mortgage
$106,000
Outstanding Balance
$67,396
Interest Rate
6.3%
Mortgage Type
Purchase Money Mortgage
Estimated Equity
$175,081
Purchase Details
Closed on
Oct 23, 2000
Sold by
Smith John Dean
Bought by
Agee John D and Mc Guire Susan Diane
Purchase Details
Closed on
Sep 18, 1996
Sold by
Dudley Susan H
Bought by
Smith John Dean
Create a Home Valuation Report for This Property
The Home Valuation Report is an in-depth analysis detailing your home's value as well as a comparison with similar homes in the area
Home Values in the Area
Average Home Value in this Area
Purchase History
| Date | Buyer | Sale Price | Title Company |
|---|---|---|---|
| Agee John D | -- | -- | |
| Agee John D | -- | -- | |
| Agee John D | $75,790 | -- | |
| Smith John Dean | $58,000 | -- |
Source: Public Records
Mortgage History
| Date | Status | Borrower | Loan Amount |
|---|---|---|---|
| Open | Agee John D | $106,000 | |
| Closed | Agee John D | $106,000 | |
| Closed | Smith John Dean | -- |
Source: Public Records
Tax History Compared to Growth
Tax History
| Year | Tax Paid | Tax Assessment Tax Assessment Total Assessment is a certain percentage of the fair market value that is determined by local assessors to be the total taxable value of land and additions on the property. | Land | Improvement |
|---|---|---|---|---|
| 2025 | $1,677 | $152,600 | $91,100 | $61,500 |
| 2024 | $1,677 | $148,367 | $0 | $0 |
| 2023 | $1,631 | $144,133 | $0 | $0 |
| 2022 | $1,585 | $139,900 | $91,100 | $48,800 |
| 2021 | $1,674 | $139,900 | $91,100 | $48,800 |
| 2020 | $1,674 | $139,900 | $91,100 | $48,800 |
| 2019 | $1,785 | $149,500 | $103,100 | $46,400 |
| 2018 | $1,746 | $147,467 | $0 | $0 |
| 2017 | $1,723 | $149,500 | $0 | $0 |
| 2016 | -- | $143,400 | $0 | $0 |
| 2015 | $1,570 | $143,333 | $0 | $0 |
| 2014 | $1,570 | $143,267 | $0 | $0 |
Source: Public Records
Map
Nearby Homes
- 1918 Millington Square
- 1912 Millington Square
- 1207 Prospect Mill Rd
- 1808 Oxford Square
- 1852 Oxford Square
- 1614 Livingston Dr
- 1026 Prospect Mill Rd
- 1012 Winfield Dr
- 1008 Winfield Dr
- 1413 Eagle Ridge Run
- 1723 Beechbank Way
- 1111 Leeswood Rd
- 1612 Bramble Ct
- 412 Tyrell Ct
- 919 Buckland Place
- 2102 Moorland Dr
- 1838 Braavos Ct
- 1803 Braavos Ct
- 1204 Athens Ct
- 2229-A Ady Rd
- 1228 Prospect Mill Rd
- 1232 Prospect Mill Rd
- 1332 Prospect Mill Rd
- 1226 Prospect Mill Rd
- 2101 Wentworth Dr
- 1300 Prospect Mill Rd
- 2100 Wentworth Dr
- 1224 Prospect Mill Rd
- 1946 Millington Square
- 1944 Millington Square
- 1302 Prospect Mill Rd
- 1942 Millington Square
- 1303 Prospect Mill Rd
- 1940 Millington Square
- 1948 Millington Square
- 1938 Millington Square
- 1950 Millington Square
- 1936 Millington Square
- 1222 Prospect Mill Rd
- 1952 Millington Square