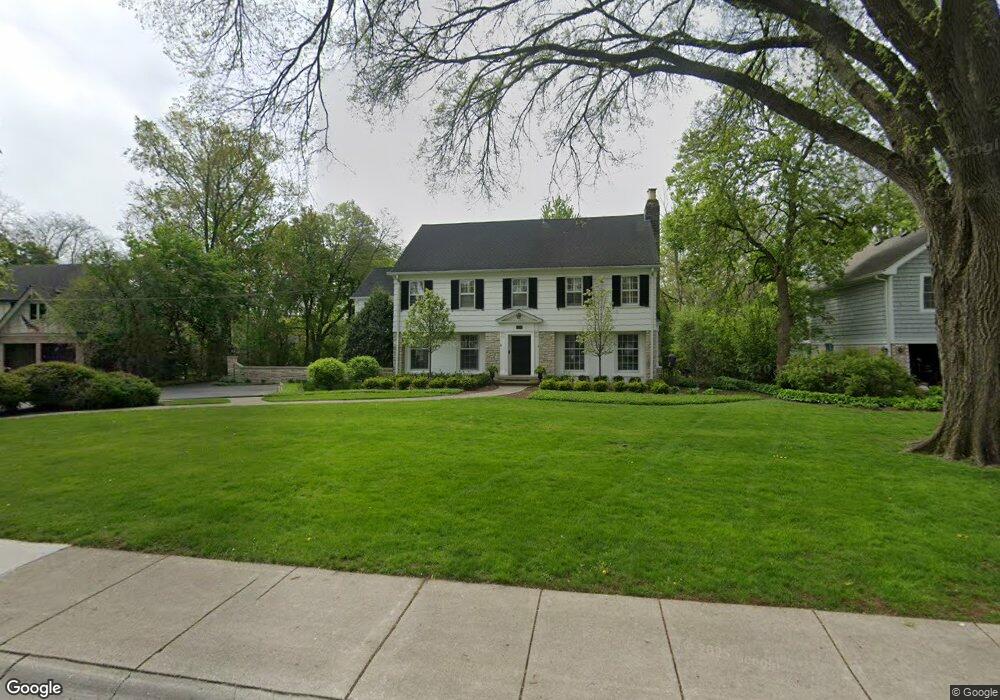
1230 Spruce St Winnetka, IL 60093
Estimated Value: $2,149,187 - $3,005,000
5
Beds
5
Baths
4,429
Sq Ft
$558/Sq Ft
Est. Value
About This Home
This home is located at 1230 Spruce St, Winnetka, IL 60093 and is currently estimated at $2,471,297, approximately $557 per square foot. 1230 Spruce St is a home located in Cook County with nearby schools including The Skokie School, Crow Island Elementary School, and The Carleton W. Washburne School.
Ownership History
Date
Name
Owned For
Owner Type
Purchase Details
Closed on
Feb 10, 2010
Sold by
Mcgarry Denis G
Bought by
Power Edward R and Power Tracy S
Current Estimated Value
Home Financials for this Owner
Home Financials are based on the most recent Mortgage that was taken out on this home.
Original Mortgage
$1,481,250
Outstanding Balance
$960,748
Interest Rate
4.87%
Mortgage Type
New Conventional
Estimated Equity
$1,510,549
Purchase Details
Closed on
Jul 8, 2002
Sold by
Lumpp Roger E and Lumpp Susan G
Bought by
Mcgarry Denis G
Home Financials for this Owner
Home Financials are based on the most recent Mortgage that was taken out on this home.
Original Mortgage
$1,000,000
Interest Rate
3.62%
Mortgage Type
Purchase Money Mortgage
Purchase Details
Closed on
Apr 2, 2002
Sold by
Lumpp Roger E and Lumpp Susan G
Bought by
Lumpp Susan G
Create a Home Valuation Report for This Property
The Home Valuation Report is an in-depth analysis detailing your home's value as well as a comparison with similar homes in the area
Home Values in the Area
Average Home Value in this Area
Purchase History
| Date | Buyer | Sale Price | Title Company |
|---|---|---|---|
| Power Edward R | $1,975,000 | Chicago Title Insurance Co | |
| Power Edward R | $1,975,000 | Chicago Title Insurance Co | |
| Mcgarry Denis G | $1,875,000 | Chicago Title Insurance Co | |
| Lumpp Susan G | -- | -- |
Source: Public Records
Mortgage History
| Date | Status | Borrower | Loan Amount |
|---|---|---|---|
| Open | Power Edward R | $1,481,250 | |
| Closed | Power Edward R | $1,481,250 | |
| Previous Owner | Mcgarry Denis G | $1,000,000 | |
| Closed | Mcgarry Denis G | $200,000 |
Source: Public Records
Tax History
| Year | Tax Paid | Tax Assessment Tax Assessment Total Assessment is a certain percentage of the fair market value that is determined by local assessors to be the total taxable value of land and additions on the property. | Land | Improvement |
|---|---|---|---|---|
| 2025 | $32,510 | $190,000 | $44,000 | $146,000 |
| 2024 | $32,510 | $143,545 | $45,000 | $98,545 |
| 2023 | $33,192 | $143,545 | $45,000 | $98,545 |
| 2022 | $33,192 | $155,499 | $45,000 | $110,499 |
| 2021 | $29,777 | $118,067 | $30,000 | $88,067 |
| 2020 | $29,361 | $118,067 | $30,000 | $88,067 |
| 2019 | $29,127 | $128,334 | $30,000 | $98,334 |
| 2018 | $48,285 | $204,741 | $25,000 | $179,741 |
| 2017 | $48,261 | $210,991 | $25,000 | $185,991 |
| 2016 | $46,160 | $210,991 | $25,000 | $185,991 |
| 2015 | $20,523 | $86,038 | $20,500 | $65,538 |
| 2014 | $21,667 | $92,564 | $20,500 | $72,064 |
| 2013 | $22,834 | $102,065 | $20,500 | $81,565 |
Source: Public Records
Map
Nearby Homes
- 1215 Spruce St
- 1295 Sunview Ln
- 1004 Elm St
- 303 Auburn Ave
- 510 Provident Ave
- 277 Hibbard Rd
- 270 Euclid Ave
- 312 Rosewood Ave
- 1159 Chatfield Rd
- 916 Oak St
- 875 Gordon Terrace
- 1333 Tower Rd
- 598 Birch St
- 979 Vine St
- 640 Winnetka Mews Unit 405
- 1255 Forest Glen Dr N
- 706 Foxdale Ave
- 838 Lincoln Ave
- 955 Vernon Ave
- 1185 Hill Rd
Your Personal Tour Guide
Ask me questions while you tour the home.