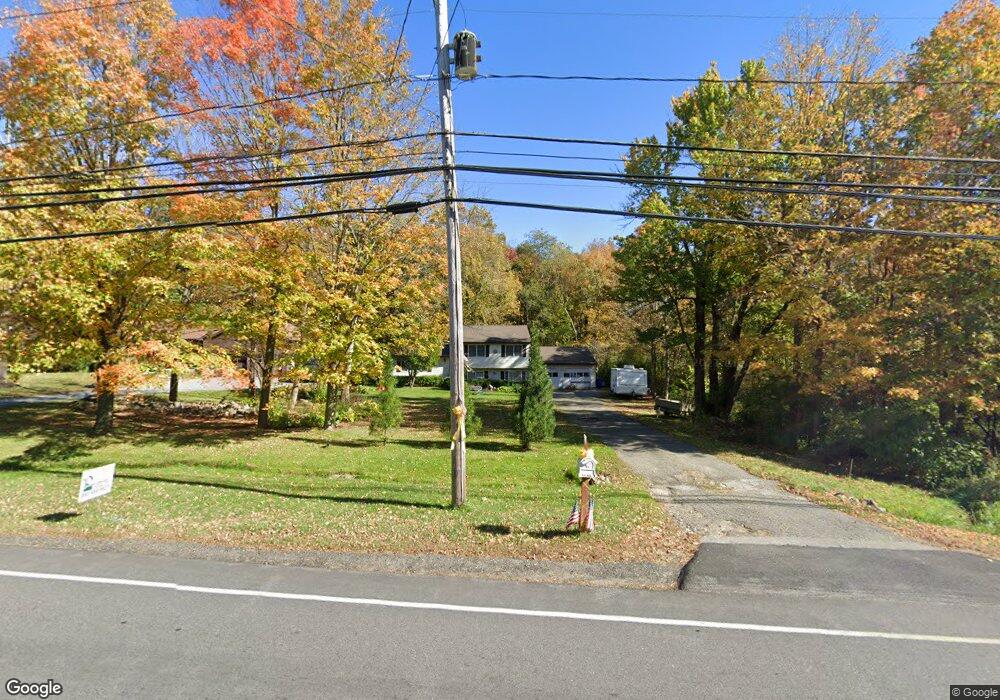
1230 Torringford St Torrington, CT 06790
Estimated Value: $308,000 - $354,190
3
Beds
2
Baths
1,700
Sq Ft
$196/Sq Ft
Est. Value
About This Home
This home is located at 1230 Torringford St, Torrington, CT 06790 and is currently estimated at $333,298, approximately $196 per square foot. 1230 Torringford St is a home located in Litchfield County with nearby schools including Torrington Middle School, Torrington High School, and Torrington Christian Academy.
Ownership History
Date
Name
Owned For
Owner Type
Purchase Details
Closed on
Jan 5, 2024
Sold by
Rossi Ernest F
Bought by
Rossi Sheree and Rossi Ernest F
Current Estimated Value
Purchase Details
Closed on
Sep 8, 1989
Sold by
Rossi Tillie
Bought by
Rossi Ernest
Home Financials for this Owner
Home Financials are based on the most recent Mortgage that was taken out on this home.
Original Mortgage
$86,750
Interest Rate
9.71%
Mortgage Type
Purchase Money Mortgage
Create a Home Valuation Report for This Property
The Home Valuation Report is an in-depth analysis detailing your home's value as well as a comparison with similar homes in the area
Home Values in the Area
Average Home Value in this Area
Purchase History
| Date | Buyer | Sale Price | Title Company |
|---|---|---|---|
| Rossi Sheree | -- | None Available | |
| Rossi Ernest | $113,000 | -- |
Source: Public Records
Mortgage History
| Date | Status | Borrower | Loan Amount |
|---|---|---|---|
| Previous Owner | Rossi Ernest | $86,750 |
Source: Public Records
Tax History Compared to Growth
Tax History
| Year | Tax Paid | Tax Assessment Tax Assessment Total Assessment is a certain percentage of the fair market value that is determined by local assessors to be the total taxable value of land and additions on the property. | Land | Improvement |
|---|---|---|---|---|
| 2025 | $7,587 | $197,330 | $24,220 | $173,110 |
| 2024 | $5,160 | $107,560 | $24,260 | $83,300 |
| 2023 | $5,159 | $107,560 | $24,260 | $83,300 |
| 2022 | $5,070 | $107,560 | $24,260 | $83,300 |
| 2021 | $4,966 | $107,560 | $24,260 | $83,300 |
| 2020 | $4,966 | $107,560 | $24,260 | $83,300 |
| 2019 | $4,898 | $106,090 | $29,800 | $76,290 |
| 2018 | $4,898 | $106,090 | $29,800 | $76,290 |
| 2017 | $4,854 | $106,090 | $29,800 | $76,290 |
| 2016 | $4,854 | $106,090 | $29,800 | $76,290 |
| 2015 | $4,854 | $106,090 | $29,800 | $76,290 |
| 2014 | $5,082 | $139,920 | $51,910 | $88,010 |
Source: Public Records
Map
Nearby Homes
- 420 Allison Dr
- 144 Woodlawn Dr
- 1683 Torringford St
- 714 Torringford St
- 1526 Litchfield Turnpike
- 68 Knollwood Dr
- 595 Torringford St
- 1480 Litchfield Turnpike
- 100 Nutmeg Dr
- 211 Lyman Dr
- 116 Albany St
- 158 Cypress Ct Unit 158
- 35 Hemlock Dr
- 46 Cedar Knoll
- 302 Gillette Rd
- 290 Gillette Rd
- 00 Kennedy Dr
- 177 Lisle St Unit 5
- 2195 Torringford St
- 111 Oxbow Dr
- 1242 Torringford St
- 1250 Torringford St
- 1258 Torringford St
- 1184 Torringford St
- 1276 Torringford St
- 1225 Torringford St
- 1196 Torringford St
- 1237 Torringford St
- 1280 Torringford St
- 1201 Torringford St
- 1191 Torringford St
- 1257 Torringford St
- 1164 Torringford St
- 00 Gaylord Ln
- 62 Gaylord Ln
- 1267 Torringford St
- 1177 Torringford St
- 27 Allison Dr
- 41 Allison Dr
- 15 Allison Dr