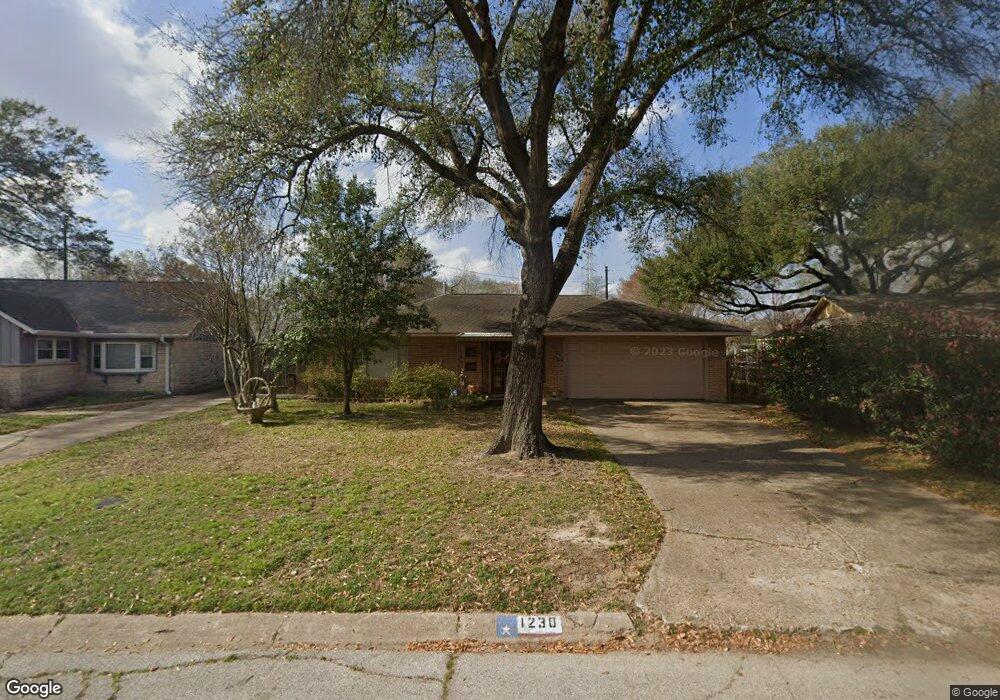
1230 W 31st St Houston, TX 77018
Oak Forest-Garden Oaks NeighborhoodEstimated Value: $395,000 - $479,789
3
Beds
2
Baths
1,313
Sq Ft
$334/Sq Ft
Est. Value
About This Home
This home is located at 1230 W 31st St, Houston, TX 77018 and is currently estimated at $438,197, approximately $333 per square foot. 1230 W 31st St is a home located in Harris County with nearby schools including Garden Oaks Montessori, Frank Black Middle School, and Waltrip High School.
Ownership History
Date
Name
Owned For
Owner Type
Purchase Details
Closed on
Mar 14, 2025
Sold by
Sparacino Gladys
Bought by
Arens Land Holdings Llc
Current Estimated Value
Home Financials for this Owner
Home Financials are based on the most recent Mortgage that was taken out on this home.
Original Mortgage
$453,094
Outstanding Balance
$450,811
Interest Rate
6.95%
Mortgage Type
New Conventional
Estimated Equity
-$12,614
Purchase Details
Closed on
Mar 28, 2022
Sold by
Gladys Sparacino
Bought by
Sparacino Gladys
Purchase Details
Closed on
Feb 8, 2011
Sold by
Sparacino Lee and Sparacino Leonardo
Bought by
Sparacino Gladys
Purchase Details
Closed on
Mar 7, 2007
Sold by
Wisnieske Henry J and Henley Barbara Ann
Bought by
Sparacino Lee and Sparacino Gladys
Purchase Details
Closed on
Sep 18, 2001
Sold by
Wisnieske Emelie Helen and Wisnieske Henry J
Bought by
Wisnieske Henry J
Create a Home Valuation Report for This Property
The Home Valuation Report is an in-depth analysis detailing your home's value as well as a comparison with similar homes in the area
Home Values in the Area
Average Home Value in this Area
Purchase History
| Date | Buyer | Sale Price | Title Company |
|---|---|---|---|
| Arens Land Holdings Llc | -- | Trinity Title | |
| Sparacino Gladys | -- | None Listed On Document | |
| Sparacino Gladys | -- | None Available | |
| Sparacino Lee | -- | Stewart Title | |
| Wisnieske Henry J | -- | -- |
Source: Public Records
Mortgage History
| Date | Status | Borrower | Loan Amount |
|---|---|---|---|
| Open | Arens Land Holdings Llc | $453,094 |
Source: Public Records
Tax History Compared to Growth
Tax History
| Year | Tax Paid | Tax Assessment Tax Assessment Total Assessment is a certain percentage of the fair market value that is determined by local assessors to be the total taxable value of land and additions on the property. | Land | Improvement |
|---|---|---|---|---|
| 2025 | $1,082 | $509,245 | $466,380 | $42,865 |
| 2024 | $1,082 | $487,984 | $466,380 | $21,604 |
| 2023 | $1,082 | $428,467 | $408,083 | $20,384 |
| 2022 | $8,356 | $402,168 | $349,785 | $52,383 |
| 2021 | $8,041 | $345,000 | $291,488 | $53,512 |
| 2020 | $8,523 | $351,962 | $291,488 | $60,474 |
| 2019 | $9,369 | $374,533 | $291,488 | $83,045 |
| 2018 | $2,016 | $383,356 | $291,488 | $91,868 |
| 2017 | $7,737 | $383,356 | $291,488 | $91,868 |
| 2016 | $7,034 | $383,356 | $291,488 | $91,868 |
| 2015 | $1,548 | $392,457 | $291,488 | $100,969 |
| 2014 | $1,548 | $240,000 | $174,893 | $65,107 |
Source: Public Records
Map
Nearby Homes
- 1226 Stonecrest Dr
- 1235 Ansbury Dr
- 1119 W 30th St
- 1115 Gardendale Dr
- 1041 Gardendale Dr
- 3505 Golf Dr Unit D
- 1414 W 34th 1/2 St
- 1424 W 34th 1/2 St
- The Austin Plan at Park View
- The Bennett Plan at Park View
- 3511 Autumndale Dr
- 3502 Autumndale Dr
- 2609 Bevis St
- 915 W 35th St Unit B
- 2634 Couch St
- 3607 Cedar Vista Ln
- 2667 Shady Acres Landing
- 1413 W 26th St
- 2623 Shady Woods Ln
- 3203 Garden Oaks View
- 1234 W 31st St
- 1226 W 31st St
- 1238 W 31st St
- 1222 W 31st St
- 1231 Ansbury Dr
- 1227 W 31st St
- 1218 W 31st St
- 1242 W 31st St
- 1230 Stonecrest Dr
- 1219 W 31st St
- 1239 Ansbury Dr
- 1214 W 31st St
- 1222 Stonecrest Dr
- 1218 Stonecrest Dr
- 1243 Ansbury Dr
- 1210 W 31st St
- 1211 W 31st St
- 1214 Stonecrest Dr
- 1302 W 31st St
- 1235 Stonecrest Dr