1230 Westchester Unit 1 Greensboro, GA 30642
Estimated Value: $1,434,028 - $2,034,000
4
Beds
3
Baths
4,481
Sq Ft
$362/Sq Ft
Est. Value
About This Home
This home is located at 1230 Westchester Unit 1, Greensboro, GA 30642 and is currently estimated at $1,620,007, approximately $361 per square foot. 1230 Westchester Unit 1 is a home located in Greene County with nearby schools including Greene County High School.
Ownership History
Date
Name
Owned For
Owner Type
Purchase Details
Closed on
Aug 28, 2019
Sold by
Pullman Larry
Bought by
Rivers William E and Rivers Kathryn L
Current Estimated Value
Purchase Details
Closed on
Feb 23, 2017
Sold by
Pullman Larry
Bought by
Pullman Larry and Pullman Sherry L
Purchase Details
Closed on
Jun 1, 2016
Sold by
Weidman Farley Sheila M
Bought by
Pullman Larry
Purchase Details
Closed on
Aug 9, 2004
Sold by
Turna Ayham and Edith Ann
Bought by
Farley Edwin F and Farley Sheila M
Purchase Details
Closed on
Jun 5, 2002
Sold by
Rivercrest Homes Inc---See
Bought by
Turna Ayham and Edith Ann
Purchase Details
Closed on
Apr 19, 2000
Sold by
Mermaid Trading Aps
Bought by
Rivercrest Homes Inc---See
Purchase Details
Closed on
Dec 3, 1999
Sold by
Mermaid Trading Aps
Bought by
Mermaid Trading Aps
Purchase Details
Closed on
Oct 1, 1990
Sold by
Lassen Arne
Bought by
Mermaid Trading Aps
Purchase Details
Closed on
Sep 12, 1990
Sold by
Harbor Club Lp
Bought by
Lassen Arne
Purchase Details
Closed on
Apr 12, 1989
Bought by
Harbor Club Lp
Create a Home Valuation Report for This Property
The Home Valuation Report is an in-depth analysis detailing your home's value as well as a comparison with similar homes in the area
Home Values in the Area
Average Home Value in this Area
Purchase History
| Date | Buyer | Sale Price | Title Company |
|---|---|---|---|
| Rivers William E | $739,000 | -- | |
| Pullman Larry | -- | -- | |
| Pullman Larry | $605,000 | -- | |
| Farley Edwin F | $565,900 | -- | |
| Turna Ayham | $509,000 | -- | |
| Rivercrest Homes Inc---See | $226,000 | -- | |
| Mermaid Trading Aps | -- | -- | |
| Mermaid Trading Aps | -- | -- | |
| Lassen Arne | $75,000 | -- | |
| Harbor Club Lp | -- | -- |
Source: Public Records
Tax History Compared to Growth
Tax History
| Year | Tax Paid | Tax Assessment Tax Assessment Total Assessment is a certain percentage of the fair market value that is determined by local assessors to be the total taxable value of land and additions on the property. | Land | Improvement |
|---|---|---|---|---|
| 2024 | $4,364 | $500,760 | $191,200 | $309,560 |
| 2023 | $4,083 | $501,080 | $191,200 | $309,880 |
| 2022 | $4,848 | $433,640 | $191,200 | $242,440 |
| 2021 | $4,364 | $356,800 | $163,120 | $193,680 |
| 2020 | $5,121 | $250,440 | $31,200 | $219,240 |
| 2019 | $4,377 | $210,480 | $31,200 | $179,280 |
| 2018 | $4,362 | $210,480 | $31,200 | $179,280 |
| 2017 | $4,084 | $208,408 | $31,200 | $177,208 |
| 2016 | $4,316 | $210,446 | $31,200 | $179,246 |
| 2015 | $4,301 | $210,445 | $31,200 | $179,246 |
| 2014 | $4,596 | $219,748 | $60,000 | $159,748 |
Source: Public Records
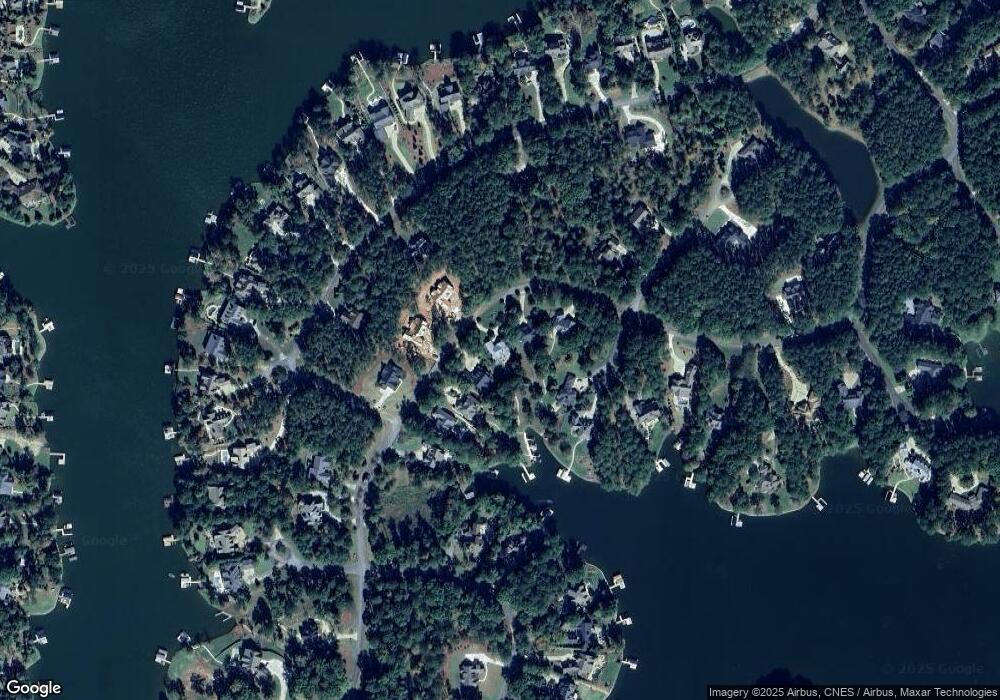
Map
Nearby Homes
- 2700 Club Dr
- 1311 Lighthouse
- 1071 Westchester Dr
- 2660 Club Dr
- 2031 Pine Valley Ct
- 1390 Winged Foot Dr
- 1611 Lighthouse Cir
- 1010 Troon Ct
- 2541 Club Dr
- 1080 Glen Eagle Dr
- 1070 Glen Eagle Dr
- 1270 Glen Eagle Dr
- 1040 Osprey Cir
- 1041 Glen Eagle Dr
- 1131 Pinehurst Dr
- 1261 Glen Eagle Dr
- 1101 Shoal Creek Ct
- 1050 Spy Glass Hill
- 2151 Osprey Poynte
- 1091 Pinehurst Dr
- 1230 Westchester
- 1220 Westchester
- 1240 Westchester
- 1210 Westchester Unit 5
- 1210 Westchester
- 1250 Westchester Unit 1
- 1250 Westchester
- 1241 Westchester Unit 1175
- 1241 Westchester
- 1231 Westchester Unit 1174
- 1231 Westchester
- 1001 Pine Valley Ct
- 1251 Westchester Unit 1176
- 1251 Westchester
- 1260 Westchester
- 1221 Westchester Dr Unit 1173
- 1221 Westchester Dr
- 1168 Pine Valley Ct
- 1020 Pine Valley Ct
- 1261 Westchester