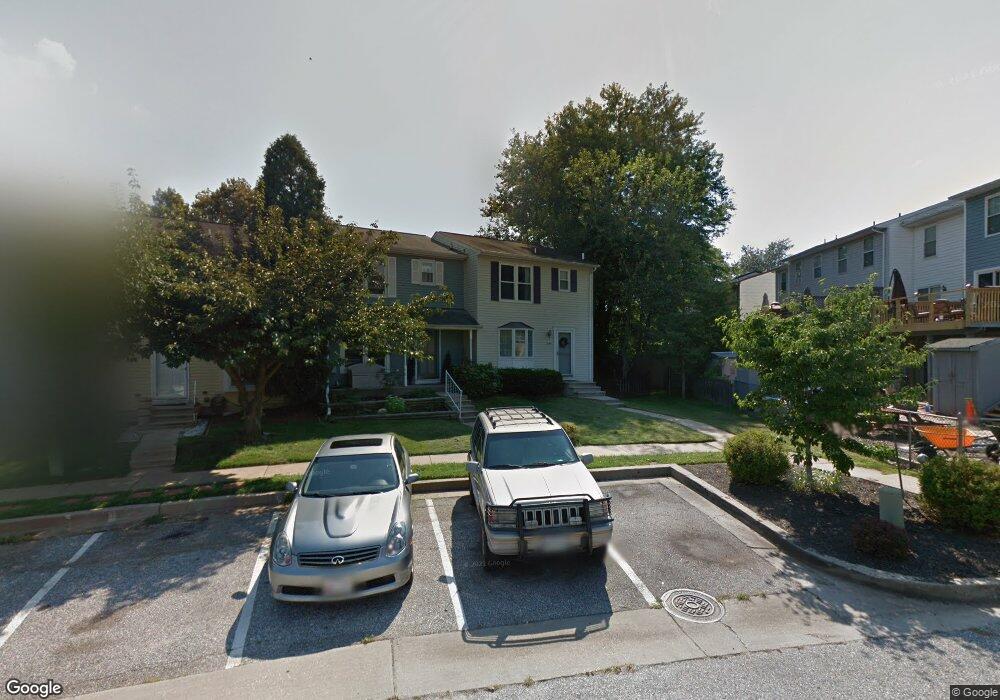
12300 Bonmot Place Reisterstown, MD 21136
Estimated Value: $250,367 - $266,000
--
Bed
2
Baths
1,120
Sq Ft
$231/Sq Ft
Est. Value
About This Home
This home is located at 12300 Bonmot Place, Reisterstown, MD 21136 and is currently estimated at $258,342, approximately $230 per square foot. 12300 Bonmot Place is a home located in Baltimore County with nearby schools including Glyndon Elementary School, Franklin Middle, and Franklin High.
Ownership History
Date
Name
Owned For
Owner Type
Purchase Details
Closed on
Nov 22, 2021
Sold by
Brougham Reo Owner Lp
Bought by
Chen Yang Kwan and Wong Ai Chan
Current Estimated Value
Purchase Details
Closed on
Jun 11, 2020
Sold by
Wilmington Savings Fund Society
Bought by
Brougham Reo Owner Lp
Purchase Details
Closed on
Apr 13, 2020
Sold by
Ellis Charles G and Ellis Chanel Y
Bought by
Wilmington Savings Fund Society and Brougam Fund I Trusts
Purchase Details
Closed on
May 12, 2006
Sold by
Saylors Carey
Bought by
Ellis Charles G and Ellis Chanel Y
Purchase Details
Closed on
Jun 23, 2003
Sold by
Brunson Daniel J
Bought by
Saylors Carey
Purchase Details
Closed on
Mar 24, 1994
Sold by
Risner Michael R
Bought by
Brunson Daniel J
Home Financials for this Owner
Home Financials are based on the most recent Mortgage that was taken out on this home.
Original Mortgage
$91,100
Interest Rate
7.15%
Create a Home Valuation Report for This Property
The Home Valuation Report is an in-depth analysis detailing your home's value as well as a comparison with similar homes in the area
Home Values in the Area
Average Home Value in this Area
Purchase History
| Date | Buyer | Sale Price | Title Company |
|---|---|---|---|
| Chen Yang Kwan | $210,001 | Bay National Title Co | |
| Chen Yang Kwan | $210,001 | Bay National Title | |
| Brougham Reo Owner Lp | -- | None Available | |
| Wilmington Savings Fund Society | $152,300 | None Available | |
| Ellis Charles G | $206,000 | -- | |
| Saylors Carey | $119,000 | -- | |
| Brunson Daniel J | $90,500 | -- |
Source: Public Records
Mortgage History
| Date | Status | Borrower | Loan Amount |
|---|---|---|---|
| Previous Owner | Brunson Daniel J | $91,100 |
Source: Public Records
Tax History Compared to Growth
Tax History
| Year | Tax Paid | Tax Assessment Tax Assessment Total Assessment is a certain percentage of the fair market value that is determined by local assessors to be the total taxable value of land and additions on the property. | Land | Improvement |
|---|---|---|---|---|
| 2025 | $3,249 | $192,200 | -- | -- |
| 2024 | $3,249 | $176,400 | $46,400 | $130,000 |
| 2023 | $3,161 | $173,600 | $0 | $0 |
| 2022 | $2,877 | $170,800 | $0 | $0 |
| 2021 | $1,992 | $168,000 | $46,400 | $121,600 |
| 2020 | $1,992 | $164,333 | $0 | $0 |
| 2019 | $1,947 | $160,667 | $0 | $0 |
| 2018 | $2,670 | $157,000 | $46,400 | $110,600 |
| 2017 | $2,586 | $152,067 | $0 | $0 |
| 2016 | -- | $147,133 | $0 | $0 |
| 2015 | $4,610 | $142,200 | $0 | $0 |
| 2014 | $4,610 | $142,200 | $0 | $0 |
Source: Public Records
Map
Nearby Homes
- 12279 Bonmot Place
- 12286 Bonmot Place
- 12322 Bonmot Place
- 616 Saint Georges Station Rd
- 16 Raindrop Cir
- 625 Glynita Cir
- 12366 Bonfire Dr
- 12380 Boncrest Dr
- 36 Brampton Ct
- 8 Empire Ct
- 12406 Old Grey Mare Ct
- 10 Greensborough Rd
- 12 Greensborough Rd
- 31 Merino Ct
- 10 Simpson Ct
- 534 Kennington Rd
- 12328 Timber Grove Rd
- 409 Fox View Ct
- 13 Bellinger Ct
- 17 Harrod Ct
- 12298 Bonmot Place
- 58 Craftsman Ct
- 12296 Bonmot Place
- 669 Glynock Place
- 667 Glynock Place
- 671 Glynock Place
- 12294 Bonmot Place
- 665 Glynock Place
- 56 Craftsman Ct
- 673 Glynock Place
- 663 Glynock Place
- 12292 Bonmot Place
- 54 Craftsman Ct
- 661 Glynock Place
- 12290 Bonmot Place
- 659 Glynock Place
- 52 Craftsman Ct
- 50 Craftsman Ct
- 657 Glynock Place
- 48 Craftsman Ct