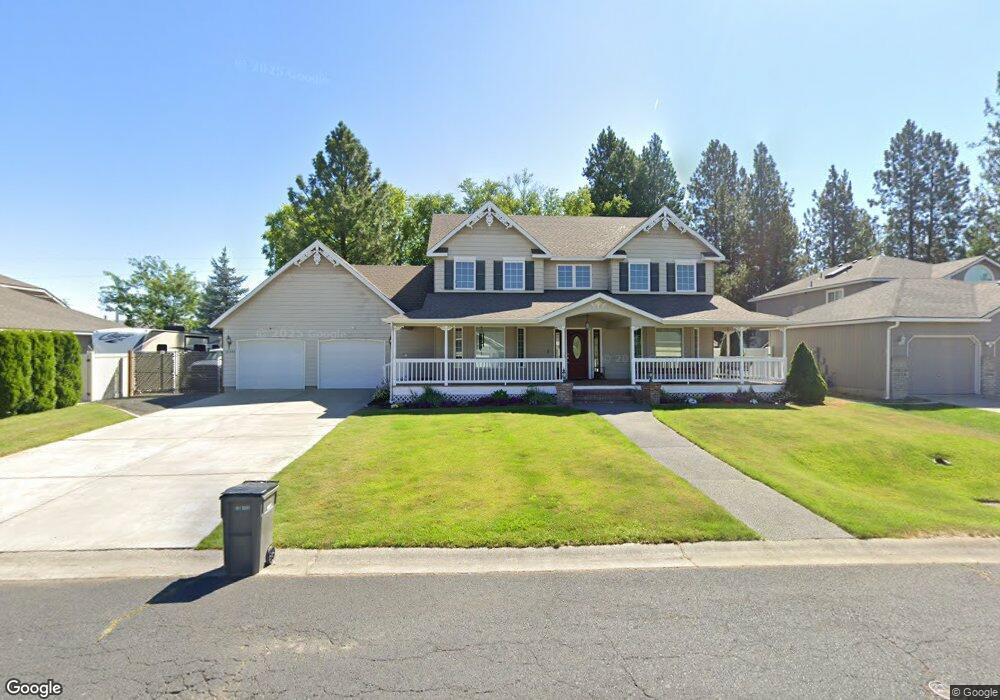
12304 N Denver Dr Spokane, WA 99218
Estimated Value: $575,373 - $674,000
3
Beds
3
Baths
2,584
Sq Ft
$240/Sq Ft
Est. Value
About This Home
This home is located at 12304 N Denver Dr, Spokane, WA 99218 and is currently estimated at $620,093, approximately $239 per square foot. 12304 N Denver Dr is a home located in Spokane County with nearby schools including Farwell Elementary School, Northwood Middle School, and Mead Senior High School.
Ownership History
Date
Name
Owned For
Owner Type
Purchase Details
Closed on
Jun 30, 2011
Sold by
Schwartze Daniel J and Schwartze Evelyn
Bought by
Sherman David J and Sherman Amber L
Current Estimated Value
Home Financials for this Owner
Home Financials are based on the most recent Mortgage that was taken out on this home.
Original Mortgage
$182,000
Outstanding Balance
$125,388
Interest Rate
4.54%
Mortgage Type
New Conventional
Estimated Equity
$494,705
Purchase Details
Closed on
Jul 26, 2002
Sold by
Becker Louis and Becker Ann Louise
Bought by
Schwartze Daniel J and Schwartze Evelyn
Home Financials for this Owner
Home Financials are based on the most recent Mortgage that was taken out on this home.
Original Mortgage
$148,400
Interest Rate
6.6%
Mortgage Type
Construction
Create a Home Valuation Report for This Property
The Home Valuation Report is an in-depth analysis detailing your home's value as well as a comparison with similar homes in the area
Home Values in the Area
Average Home Value in this Area
Purchase History
| Date | Buyer | Sale Price | Title Company |
|---|---|---|---|
| Sherman David J | $275,280 | Pacific Northwest Title | |
| Schwartze Daniel J | $34,000 | First American Title Ins |
Source: Public Records
Mortgage History
| Date | Status | Borrower | Loan Amount |
|---|---|---|---|
| Open | Sherman David J | $182,000 | |
| Previous Owner | Schwartze Daniel J | $148,400 |
Source: Public Records
Tax History Compared to Growth
Tax History
| Year | Tax Paid | Tax Assessment Tax Assessment Total Assessment is a certain percentage of the fair market value that is determined by local assessors to be the total taxable value of land and additions on the property. | Land | Improvement |
|---|---|---|---|---|
| 2025 | $5,036 | $507,500 | $125,000 | $382,500 |
| 2024 | $5,036 | $493,100 | $110,000 | $383,100 |
| 2023 | $4,409 | $488,100 | $105,000 | $383,100 |
| 2022 | $4,919 | $473,400 | $98,000 | $375,400 |
| 2021 | $4,044 | $349,900 | $62,000 | $287,900 |
| 2020 | $4,094 | $337,900 | $62,000 | $275,900 |
| 2019 | $3,705 | $309,100 | $50,000 | $259,100 |
| 2018 | $4,001 | $284,800 | $43,000 | $241,800 |
| 2017 | $3,742 | $267,500 | $43,000 | $224,500 |
| 2016 | $3,847 | $267,600 | $43,000 | $224,600 |
| 2015 | $3,819 | $271,900 | $50,000 | $221,900 |
| 2014 | -- | $251,200 | $50,000 | $201,200 |
| 2013 | -- | $0 | $0 | $0 |
Source: Public Records
Map
Nearby Homes
- 1124 E Brierwood Dr
- 1107 E Chantel Dr
- 1305 E Hastings Rd
- 916 E Farwell Rd
- 723 E Hastings Rd
- 12102 N N Nevada Ct
- 11815 N King Arthur Dr
- 11712 N King Arthur Dr
- 12729 N Dakota St
- 12265 N Valencia Ave
- 12258 N Valencia Ave
- 12274 N Valencia Ave
- 12237 N Valencia Ave
- 12249 N Valencia Ave
- 12213 N Valencia Ave
- 12279 N Valencia Ave
- 12167 N Montfort Ave
- 12145 N Montfort St
- 12157 N Montfort St
- 12170 N Montfort St
- 12220 N Denver Dr
- 12312 N Denver Dr
- 0 N Denver Dr
- 0 N Denver Dr
- 12307 N Perry St
- 12303 N Denver Dr
- 12206 N Denver Dr
- 1306 E Mead St
- 12311 N Denver Dr
- 12315 N Perry St
- 12219 N Denver Dr
- 12321 N Denver Dr
- 12205 N Denver Dr
- 12120 N Denver Dr
- 1219 E Brierwood Dr
- 12306 N Perry St
- 1226 E Mead St
- 12119 N Denver Dr
- 12312 N Perry St
- 12404 N Denver Dr