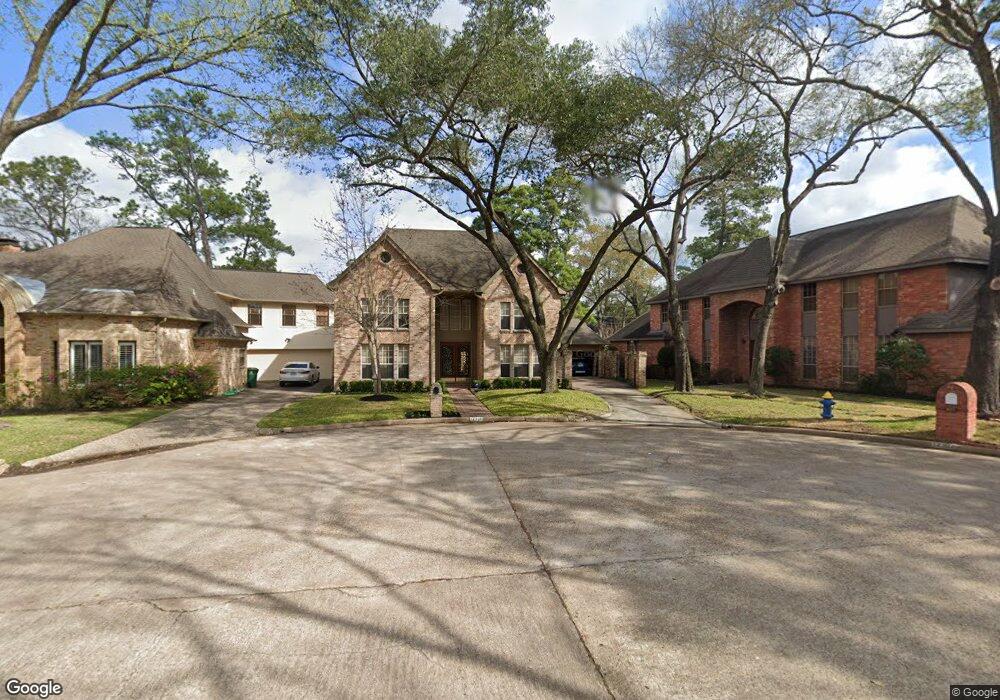
12306 Tealwood North Dr Houston, TX 77024
Memorial NeighborhoodEstimated Value: $1,215,000 - $1,626,000
4
Beds
4
Baths
3,134
Sq Ft
$428/Sq Ft
Est. Value
About This Home
This home is located at 12306 Tealwood North Dr, Houston, TX 77024 and is currently estimated at $1,341,779, approximately $428 per square foot. 12306 Tealwood North Dr is a home located in Harris County with nearby schools including Frostwood Elementary School, Memorial Middle, and Memorial High School.
Ownership History
Date
Name
Owned For
Owner Type
Purchase Details
Closed on
Nov 10, 2011
Sold by
Folger Michelle Leblanc and Leblanc Michelle Y
Bought by
Folger William R
Current Estimated Value
Purchase Details
Closed on
Feb 28, 2001
Sold by
Scheffler M G and Scheffler Wanda M
Bought by
Folger William R and Leblanc Michelle Y
Home Financials for this Owner
Home Financials are based on the most recent Mortgage that was taken out on this home.
Original Mortgage
$381,600
Interest Rate
6.81%
Purchase Details
Closed on
Jan 26, 1994
Sold by
Whitehead R Dwayne and Whitehead Jodell H
Bought by
Scheffler M G and Scheffler Wanda M
Home Financials for this Owner
Home Financials are based on the most recent Mortgage that was taken out on this home.
Original Mortgage
$225,700
Interest Rate
7.16%
Create a Home Valuation Report for This Property
The Home Valuation Report is an in-depth analysis detailing your home's value as well as a comparison with similar homes in the area
Home Values in the Area
Average Home Value in this Area
Purchase History
| Date | Buyer | Sale Price | Title Company |
|---|---|---|---|
| Folger William R | -- | None Available | |
| Folger William R | -- | Alamo Title Company | |
| Scheffler M G | -- | Lawyers Title Co Of Houston |
Source: Public Records
Mortgage History
| Date | Status | Borrower | Loan Amount |
|---|---|---|---|
| Previous Owner | Folger William R | $381,600 | |
| Previous Owner | Scheffler M G | $225,700 | |
| Closed | Folger William R | $47,700 |
Source: Public Records
Tax History Compared to Growth
Tax History
| Year | Tax Paid | Tax Assessment Tax Assessment Total Assessment is a certain percentage of the fair market value that is determined by local assessors to be the total taxable value of land and additions on the property. | Land | Improvement |
|---|---|---|---|---|
| 2025 | $10,013 | $1,041,058 | $556,116 | $484,942 |
| 2024 | $10,013 | $1,046,832 | $531,581 | $515,251 |
| 2023 | $10,013 | $1,047,947 | $531,581 | $516,366 |
| 2022 | $18,937 | $809,993 | $531,581 | $278,412 |
| 2021 | $19,067 | $780,968 | $531,581 | $249,387 |
| 2020 | $19,253 | $768,401 | $531,581 | $236,820 |
| 2019 | $20,117 | $768,401 | $531,581 | $236,820 |
| 2018 | $5,664 | $778,701 | $507,047 | $271,654 |
| 2017 | $19,172 | $778,701 | $507,047 | $271,654 |
| 2016 | $17,429 | $751,095 | $507,047 | $244,048 |
| 2015 | $11,514 | $751,095 | $507,047 | $244,048 |
| 2014 | $11,514 | $685,441 | $466,156 | $219,285 |
Source: Public Records
Map
Nearby Homes
- 12334 Beauregard Dr
- 358 Tealwood Dr
- 354 Tealwood Dr
- 12327 Tunbridge Ln
- 201 Vanderpool Ln Unit 103
- 201 Vanderpool Ln Unit 65
- 201 Vanderpool Ln Unit 64
- 336 Litchfield Ln
- 318 Litchfield Ln
- 12326 Old Oaks Dr
- 271 Litchfield Ln
- 234 Plantation Rd
- 259 Litchfield Ln Unit 66
- 12003 Tall Oaks St
- 241 Litchfield Ln
- 53 Litchfield Ln
- 0 Gessner Rd
- 115 Litchfield Ln
- 203 Memorial Parkview Dr
- 12406 Overcup Dr
- 12302 Tealwood North Dr
- 12310 Tealwood North Dr
- 12307 Beauregard Dr
- 12314 Tealwood North Dr
- 12303 Beauregard Dr
- 12303 Tealwood North Dr
- 12311 Beauregard Dr
- 416 Tealmeadow Ct
- 12318 Tealwood North Dr
- 402 Tealmeadow Ct
- 12322 Tealwood North Dr
- 12322 Tealwood North Dr
- 12231 Beauregard Dr
- 12231 Beauregard Dr Sa
- 12319 Beauregard Dr
- 419 Tealmeadow Ct
- 12306 Beauregard Dr
- 12302 Beauregard Dr
- 415 Tealmeadow Ct
- 423 Tealmeadow Ct