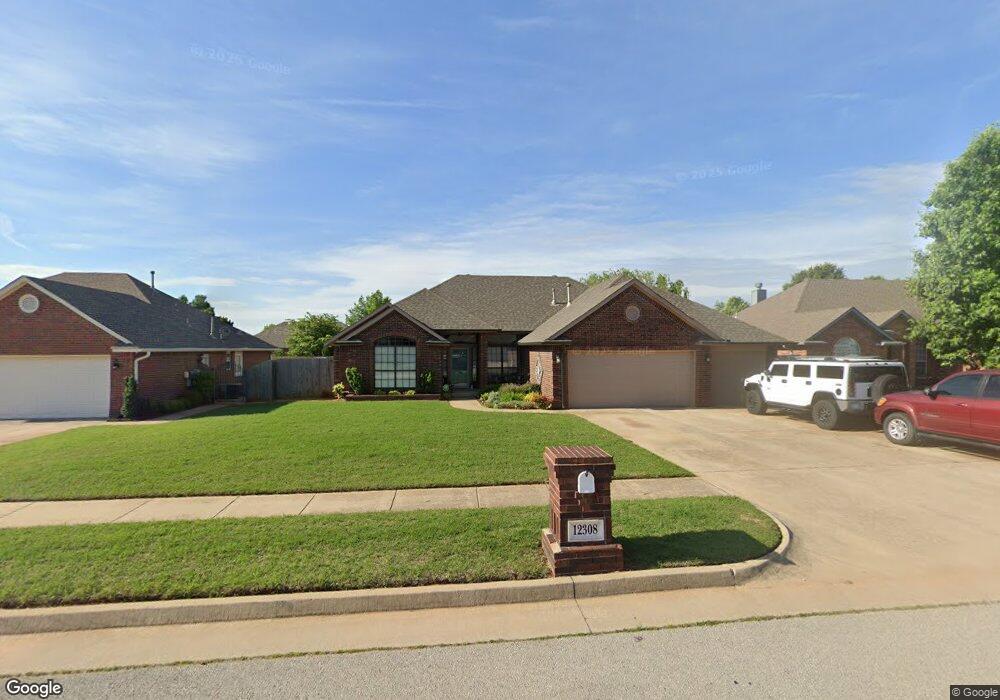
12308 SW 7th Cir Yukon, OK 73099
Westgate NeighborhoodEstimated Value: $284,903 - $313,000
4
Beds
2
Baths
2,160
Sq Ft
$138/Sq Ft
Est. Value
About This Home
This home is located at 12308 SW 7th Cir, Yukon, OK 73099 and is currently estimated at $298,226, approximately $138 per square foot. 12308 SW 7th Cir is a home located in Canadian County with nearby schools including Mustang Trails Elementary School, Meadow Brook Intermediate School, and Mustang Central Middle School.
Ownership History
Date
Name
Owned For
Owner Type
Purchase Details
Closed on
Feb 12, 2021
Sold by
Castner James and Castner Roxy
Bought by
Castner James W and Castner Roxy
Current Estimated Value
Purchase Details
Closed on
Oct 3, 2014
Sold by
Wysocki Kimberly Ann and Herron Kimberley
Bought by
Castner James
Home Financials for this Owner
Home Financials are based on the most recent Mortgage that was taken out on this home.
Original Mortgage
$148,000
Outstanding Balance
$113,589
Interest Rate
4.13%
Mortgage Type
New Conventional
Estimated Equity
$184,637
Purchase Details
Closed on
Jul 12, 2005
Sold by
Herron Leslie R
Bought by
Wysocki Kimberly Ann and Herron Kimberly A
Purchase Details
Closed on
Feb 12, 2002
Sold by
Herron Leslie R
Purchase Details
Closed on
Jun 1, 2000
Sold by
Steve Grissom Inc
Create a Home Valuation Report for This Property
The Home Valuation Report is an in-depth analysis detailing your home's value as well as a comparison with similar homes in the area
Home Values in the Area
Average Home Value in this Area
Purchase History
| Date | Buyer | Sale Price | Title Company |
|---|---|---|---|
| Castner James W | -- | Old Republic Title | |
| Castner James | $185,000 | Old Republic Title Company | |
| Wysocki Kimberly Ann | -- | Land Run Escrow & Title Serv | |
| -- | -- | -- | |
| -- | $146,000 | -- |
Source: Public Records
Mortgage History
| Date | Status | Borrower | Loan Amount |
|---|---|---|---|
| Open | Castner James | $148,000 |
Source: Public Records
Tax History Compared to Growth
Tax History
| Year | Tax Paid | Tax Assessment Tax Assessment Total Assessment is a certain percentage of the fair market value that is determined by local assessors to be the total taxable value of land and additions on the property. | Land | Improvement |
|---|---|---|---|---|
| 2024 | $2,702 | $25,611 | $2,460 | $23,151 |
| 2023 | $2,702 | $24,865 | $2,460 | $22,405 |
| 2022 | $2,660 | $24,141 | $2,460 | $21,681 |
| 2021 | $2,569 | $23,438 | $2,460 | $20,978 |
| 2020 | $2,619 | $23,638 | $2,460 | $21,178 |
| 2019 | $2,537 | $22,950 | $2,460 | $20,490 |
| 2018 | $2,505 | $22,282 | $2,460 | $19,822 |
| 2017 | $2,397 | $21,633 | $2,460 | $19,173 |
| 2016 | $2,348 | $21,267 | $2,460 | $18,807 |
| 2015 | $2,393 | $22,524 | $2,460 | $20,064 |
| 2014 | $2,393 | $21,490 | $1,980 | $19,510 |
Source: Public Records
Map
Nearby Homes
- 12325 SW 6th St
- 12401 SW 7th St
- 521 Apache Gate Dr
- 517 Cherokee Gate Dr
- 12127 SW 4th St
- 904 Norway Ave
- 418 Palo Verde Dr
- 12824 NW 4th Terrace
- 501 S Greengate Dr
- 311 Tumbleweed Rd
- 1025 Switzerland Ave
- 12400 Newgate Dr
- 708 Cactus Ct
- 12616 NW 1st Terrace
- 108 N Eastgate Dr
- 1004 Aspen Creek Terrace
- 1005 Redwood Creek Dr
- 1009 Redwood Creek Dr
- 1013 Redwood Creek Dr
- 1017 Redwood Creek Dr
- 12312 SW 7th Cir
- 12305 Westgate
- 12300 SW 7th Cir
- 12316 SW 7th Cir
- 12301 Westgate
- 12309 SW 7th Cir
- 12305 SW 7th Cir
- 12313 SW 7th Cir
- 12232 SW 7th Cir
- 12301 SW 7th Cir
- 12320 SW 7th Cir
- 12233 Westgate
- 12317 SW 7th Cir
- 12233 SW 7th Cir
- 12328 SW 6th St
- 12321 SW 7th Cir
- 12229 Westgate
- 12332 SW 6th St
- 12320 SW 6th St
- 12308 Westgate