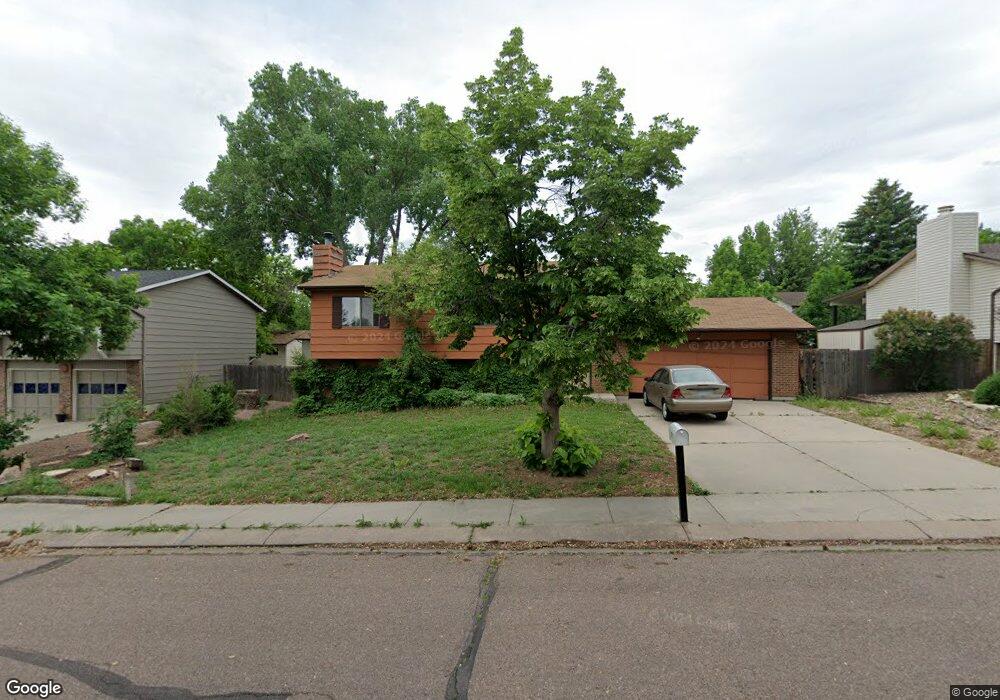
1231 Amsterdam Dr Colorado Springs, CO 80907
Holland Park NeighborhoodEstimated Value: $393,430 - $434,000
2
Beds
2
Baths
1,020
Sq Ft
$410/Sq Ft
Est. Value
About This Home
This home is located at 1231 Amsterdam Dr, Colorado Springs, CO 80907 and is currently estimated at $418,608, approximately $410 per square foot. 1231 Amsterdam Dr is a home located in El Paso County with nearby schools including Jackson Elementary School, Holmes Middle School, and Coronado High School.
Ownership History
Date
Name
Owned For
Owner Type
Purchase Details
Closed on
Apr 28, 2000
Sold by
Gonzalez Juvencio and Arredondo Olivia
Bought by
Porter David A
Current Estimated Value
Home Financials for this Owner
Home Financials are based on the most recent Mortgage that was taken out on this home.
Original Mortgage
$119,920
Outstanding Balance
$40,263
Interest Rate
7.75%
Estimated Equity
$378,345
Purchase Details
Closed on
Nov 12, 1999
Sold by
Townsend Robert H and Townsend Marcia R
Bought by
Gonzalez Juvencio and Arredondo Olivia
Home Financials for this Owner
Home Financials are based on the most recent Mortgage that was taken out on this home.
Original Mortgage
$133,932
Interest Rate
7.83%
Mortgage Type
FHA
Purchase Details
Closed on
Sep 24, 1996
Sold by
Townsend Robert H and Townsend Marcia J
Bought by
Townsend Robert H and Townsend Marcia R
Purchase Details
Closed on
Jul 26, 1988
Bought by
Porter David A
Purchase Details
Closed on
Oct 1, 1982
Bought by
Porter David A
Create a Home Valuation Report for This Property
The Home Valuation Report is an in-depth analysis detailing your home's value as well as a comparison with similar homes in the area
Home Values in the Area
Average Home Value in this Area
Purchase History
| Date | Buyer | Sale Price | Title Company |
|---|---|---|---|
| Porter David A | $149,900 | Stewart Title | |
| Gonzalez Juvencio | $135,900 | Security Title | |
| Townsend Robert H | -- | -- | |
| Porter David A | -- | -- | |
| Porter David A | -- | -- |
Source: Public Records
Mortgage History
| Date | Status | Borrower | Loan Amount |
|---|---|---|---|
| Open | Porter David A | $119,920 | |
| Previous Owner | Gonzalez Juvencio | $133,932 |
Source: Public Records
Tax History Compared to Growth
Tax History
| Year | Tax Paid | Tax Assessment Tax Assessment Total Assessment is a certain percentage of the fair market value that is determined by local assessors to be the total taxable value of land and additions on the property. | Land | Improvement |
|---|---|---|---|---|
| 2025 | $1,298 | $27,850 | -- | -- |
| 2024 | $1,185 | $27,770 | $3,850 | $23,920 |
| 2023 | $1,185 | $27,770 | $3,850 | $23,920 |
| 2022 | $1,264 | $22,590 | $3,200 | $19,390 |
| 2021 | $1,371 | $23,230 | $3,290 | $19,940 |
| 2020 | $1,269 | $18,700 | $2,930 | $15,770 |
| 2019 | $1,262 | $18,700 | $2,930 | $15,770 |
| 2018 | $1,186 | $16,170 | $2,380 | $13,790 |
| 2017 | $1,124 | $16,170 | $2,380 | $13,790 |
| 2016 | $864 | $14,900 | $2,270 | $12,630 |
| 2015 | $860 | $14,900 | $2,270 | $12,630 |
| 2014 | $845 | $14,050 | $2,270 | $11,780 |
Source: Public Records
Map
Nearby Homes
- 2794 Soleil Heights
- 995 Holli Springs Ln
- 1355 Amsterdam Ct
- 4073 Flash Point
- 4090 Star View
- 2774 Soleil Heights
- 817 Ellston St
- 1054 Kara Ridge Point
- 1470 Vondelpark Dr
- 0 Michener Dr
- 2790 Soleil Heights
- 736 Ellston St
- 1138 Tulip Place
- 4218 Forrest Hill Rd Unit A
- 1222 Glen Haven Point
- 852 Beckton Heights
- 3439 Berg Point
- 3366 Sobo View
- 3390 Bivy Point
- 3372 Bivy Point
- 1241 Amsterdam Dr
- 1221 Amsterdam Dr
- 1210 Amstel Dr
- 1150 Amstel Dr
- 1220 Amstel Dr
- 1251 Amsterdam Dr
- 1140 Amstel Dr
- 1232 Amsterdam Dr
- 1222 Amsterdam Dr
- 1242 Amsterdam Dr
- 1230 Amstel Dr
- 1212 Amsterdam Dr
- 1261 Amsterdam Dr
- 1252 Amsterdam Dr
- 1131 Amsterdam Dr
- 1120 Amstel Dr
- 1229 Vondelpark Dr
- 1054 Hans Brinker St
- 1162 Amsterdam Dr
- 1215 Amstel Dr