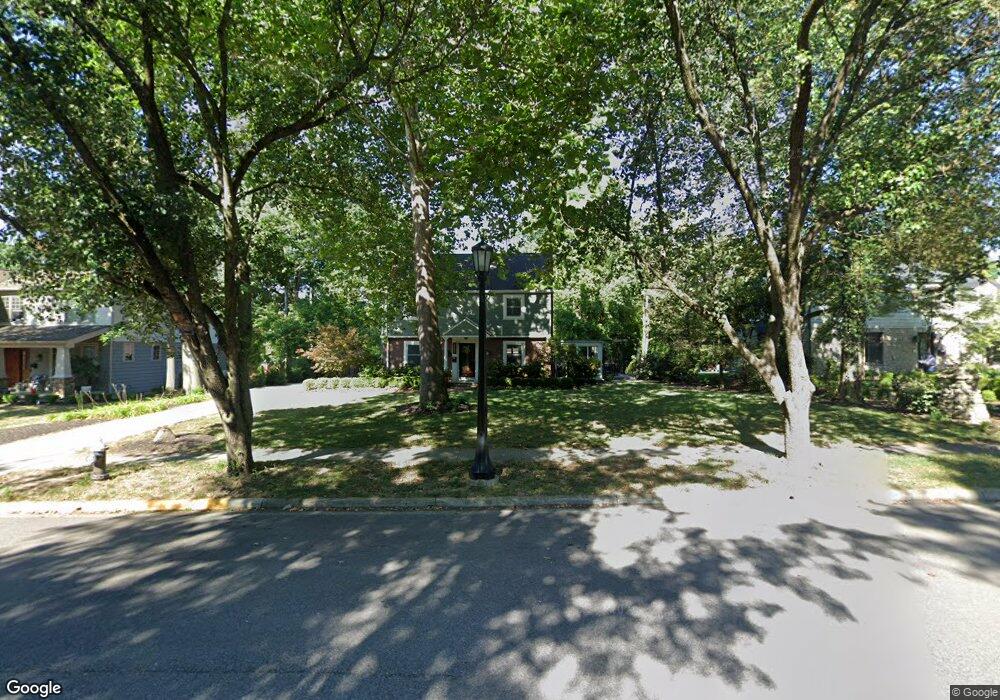
1231 Cambridge Blvd Columbus, OH 43212
Estimated Value: $893,000 - $1,221,172
3
Beds
3
Baths
2,753
Sq Ft
$376/Sq Ft
Est. Value
About This Home
This home is located at 1231 Cambridge Blvd, Columbus, OH 43212 and is currently estimated at $1,036,043, approximately $376 per square foot. 1231 Cambridge Blvd is a home located in Franklin County with nearby schools including Robert Louis Stevenson Elementary School, Larson Middle School, and Grandview Heights High School.
Ownership History
Date
Name
Owned For
Owner Type
Purchase Details
Closed on
Oct 10, 2008
Sold by
Kulik Paul E and Kulik Catherine D
Bought by
Myers Robert S and Myers Sarah H
Current Estimated Value
Home Financials for this Owner
Home Financials are based on the most recent Mortgage that was taken out on this home.
Original Mortgage
$285,000
Interest Rate
6.41%
Mortgage Type
Credit Line Revolving
Purchase Details
Closed on
Dec 24, 1996
Sold by
Wesney Larry R
Bought by
Kulik Paul E and Kulik Catherine D
Home Financials for this Owner
Home Financials are based on the most recent Mortgage that was taken out on this home.
Original Mortgage
$172,000
Interest Rate
7.74%
Mortgage Type
Balloon
Purchase Details
Closed on
Apr 1, 1987
Purchase Details
Closed on
Oct 1, 1983
Create a Home Valuation Report for This Property
The Home Valuation Report is an in-depth analysis detailing your home's value as well as a comparison with similar homes in the area
Home Values in the Area
Average Home Value in this Area
Purchase History
| Date | Buyer | Sale Price | Title Company |
|---|---|---|---|
| Myers Robert S | $330,000 | Attorney | |
| Kulik Paul E | $215,000 | -- | |
| -- | $100,000 | -- | |
| -- | -- | -- |
Source: Public Records
Mortgage History
| Date | Status | Borrower | Loan Amount |
|---|---|---|---|
| Previous Owner | Myers Robert S | $285,000 | |
| Previous Owner | Kulik Paul E | $172,000 |
Source: Public Records
Tax History Compared to Growth
Tax History
| Year | Tax Paid | Tax Assessment Tax Assessment Total Assessment is a certain percentage of the fair market value that is determined by local assessors to be the total taxable value of land and additions on the property. | Land | Improvement |
|---|---|---|---|---|
| 2024 | $15,153 | $306,570 | $133,320 | $173,250 |
| 2023 | $12,879 | $306,565 | $133,315 | $173,250 |
| 2022 | $13,549 | $270,630 | $65,980 | $204,650 |
| 2021 | $13,562 | $270,630 | $65,980 | $204,650 |
| 2020 | $13,498 | $270,630 | $65,980 | $204,650 |
| 2019 | $12,970 | $229,570 | $65,980 | $163,590 |
| 2018 | $11,706 | $224,500 | $65,980 | $158,520 |
| 2017 | $11,259 | $224,500 | $65,980 | $158,520 |
| 2016 | $10,790 | $177,490 | $60,940 | $116,550 |
| 2015 | $10,790 | $177,490 | $60,940 | $116,550 |
| 2014 | $10,929 | $177,490 | $60,940 | $116,550 |
| 2013 | $4,739 | $161,350 | $55,405 | $105,945 |
Source: Public Records
Map
Nearby Homes
- 1313 Lincoln Rd
- 1324 Lake Shore Dr Unit B
- 1301 Lake Shore Dr Unit 199
- 1263 Oakland Ave
- 1459 Elmwood Ave Unit 1459
- 2015 W 5th Ave Unit 211
- 2015 W 5th Ave Unit 102
- 2015 W 5th Ave Unit 108
- 1561 Glenn Ave
- 1214 Lake Shore Dr Unit C
- 1000 Urlin Ave Unit 1822
- 1000 Urlin Ave Unit 2007
- 1000 Urlin Ave Unit 520
- 1000 Urlin Ave Unit 605
- 1000 Urlin Ave Unit 511
- 1000 Urlin Ave Unit 1007
- 1000 Urlin Ave Unit 518
- 1000 Urlin Ave Unit 1607
- 1631 Roxbury Rd Unit F3
- 1631 Roxbury Rd Unit B6
- 1241 Cambridge Blvd
- 1221 Cambridge Blvd
- 1123 Cambridge Blvd
- 1967 Village Ct
- 1251 Cambridge Blvd
- 1973 Village Ct
- 1963 Village Ct
- 1275 Arlington Ave
- 1261 Cambridge Blvd
- 1238 Cambridge Blvd
- 1228 Cambridge Blvd
- 1977 Village Ct
- 1248 Cambridge Blvd
- 1281 Arlington Ave
- 1218 Cambridge Blvd
- 1271 Arlington Ave
- 1260 Cambridge Blvd
- 1208 Cambridge Blvd
- 1960 Village Ct
- 1956 Village Ct