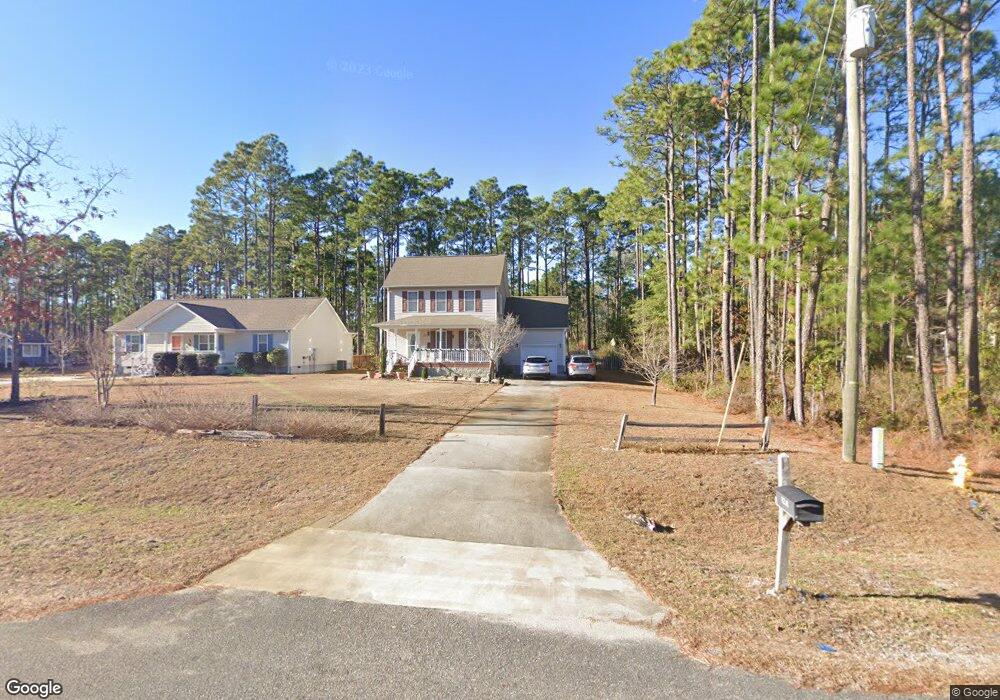
1231 Gum Rd Unit BSL Southport, NC 28461
Estimated Value: $351,675 - $395,000
3
Beds
3
Baths
1,801
Sq Ft
$205/Sq Ft
Est. Value
About This Home
This home is located at 1231 Gum Rd Unit BSL, Southport, NC 28461 and is currently estimated at $369,419, approximately $205 per square foot. 1231 Gum Rd Unit BSL is a home located in Brunswick County with nearby schools including Bolivia Elementary School, South Brunswick Middle School, and South Brunswick High School.
Ownership History
Date
Name
Owned For
Owner Type
Purchase Details
Closed on
Aug 1, 2019
Sold by
Schweppe James N and Schweppe Jill A
Bought by
Ikner Bobby Gene and Ikner Rowena L
Current Estimated Value
Home Financials for this Owner
Home Financials are based on the most recent Mortgage that was taken out on this home.
Original Mortgage
$218,000
Outstanding Balance
$191,045
Interest Rate
3.73%
Mortgage Type
VA
Estimated Equity
$178,374
Purchase Details
Closed on
Nov 21, 2005
Sold by
Coastal Construction Of Nc Inc
Bought by
Blake Home Builders Inc Nc
Home Financials for this Owner
Home Financials are based on the most recent Mortgage that was taken out on this home.
Original Mortgage
$110,000
Interest Rate
6.04%
Mortgage Type
Construction
Purchase Details
Closed on
Jul 25, 2005
Sold by
Moore Thomas J and Renne Moore S
Bought by
Coastal Construction Of Nc Inc
Create a Home Valuation Report for This Property
The Home Valuation Report is an in-depth analysis detailing your home's value as well as a comparison with similar homes in the area
Home Values in the Area
Average Home Value in this Area
Purchase History
| Date | Buyer | Sale Price | Title Company |
|---|---|---|---|
| Ikner Bobby Gene | $222,000 | None Available | |
| Blake Home Builders Inc Nc | $40,000 | None Available | |
| Coastal Construction Of Nc Inc | $20,000 | None Available |
Source: Public Records
Mortgage History
| Date | Status | Borrower | Loan Amount |
|---|---|---|---|
| Open | Ikner Bobby Gene | $218,000 | |
| Previous Owner | Blake Home Builders Inc Nc | $110,000 |
Source: Public Records
Tax History Compared to Growth
Tax History
| Year | Tax Paid | Tax Assessment Tax Assessment Total Assessment is a certain percentage of the fair market value that is determined by local assessors to be the total taxable value of land and additions on the property. | Land | Improvement |
|---|---|---|---|---|
| 2025 | $1,671 | $321,590 | $14,000 | $307,590 |
| 2024 | $1,671 | $321,590 | $14,000 | $307,590 |
| 2023 | $1,725 | $321,590 | $14,000 | $307,590 |
| 2022 | $1,725 | $205,140 | $11,000 | $194,140 |
| 2021 | $1,711 | $205,140 | $11,000 | $194,140 |
| 2020 | $1,604 | $205,140 | $11,000 | $194,140 |
| 2019 | $1,604 | $16,630 | $11,000 | $5,630 |
| 2018 | $1,367 | $16,710 | $10,000 | $6,710 |
| 2017 | $1,332 | $16,710 | $10,000 | $6,710 |
| 2016 | $1,307 | $16,710 | $10,000 | $6,710 |
| 2015 | $1,307 | $173,680 | $10,000 | $163,680 |
| 2014 | $1,158 | $172,677 | $23,000 | $149,677 |
Source: Public Records
Map
Nearby Homes
- 1210 Grace Rd
- 241 Ash Rd
- L-125 Baymeade Rd
- Lot 45-47 Juniper Rd
- Lot 576 Juniper Rd
- 1893 Juniper Rd
- 1797 Juniper Rd
- Lot 83 Beech Rd
- 231 Cherry Rd
- 1695 Beech Rd
- 1773 Beech Rd
- 371 & 381 Elm
- 801-805 Glen Oak Dr
- 286 Elm St
- 1372 E Boiling Spring Rd
- 253 Sycamore Rd
- 1478 E Boiling Spring Rd
- 69 Elm St
- 53 Elm St
- 1134 N Shore Dr