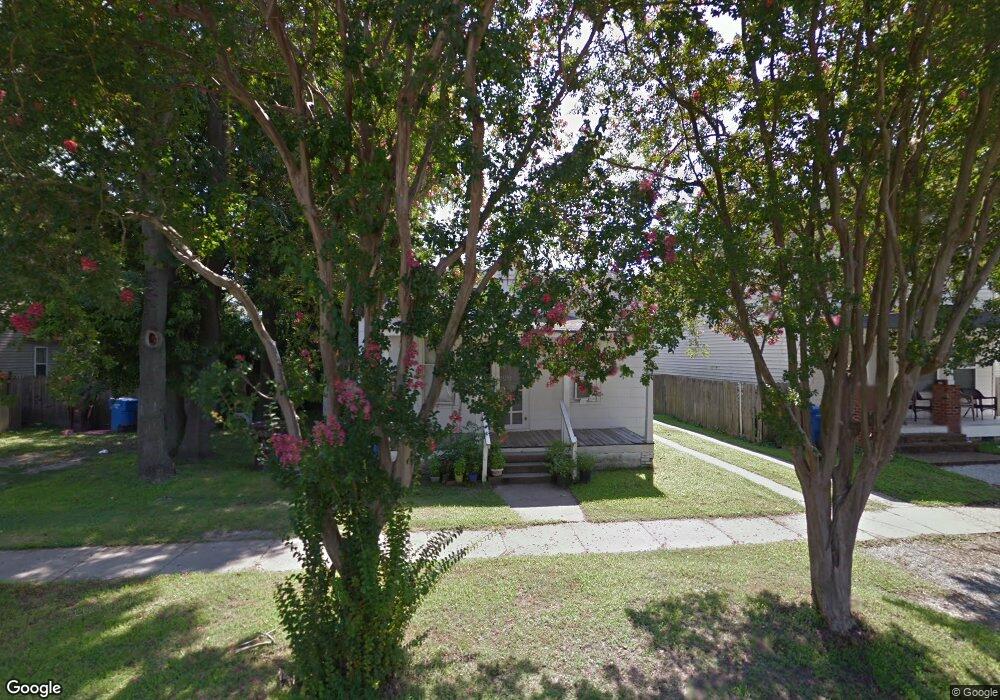
1231 Hull St Chesapeake, VA 23324
South Norfolk NeighborhoodEstimated Value: $233,000 - $269,000
2
Beds
2
Baths
1,106
Sq Ft
$222/Sq Ft
Est. Value
About This Home
This home is located at 1231 Hull St, Chesapeake, VA 23324 and is currently estimated at $245,776, approximately $222 per square foot. 1231 Hull St is a home located in Chesapeake City with nearby schools including Rena B. Wright Primary School, Truitt Intermediate School, and Oscar Smith Middle School.
Ownership History
Date
Name
Owned For
Owner Type
Purchase Details
Closed on
Feb 7, 2024
Sold by
Brown Jeffrey and Brown Jeffery A
Bought by
Meads Landon and Del-Castillo Dennis
Current Estimated Value
Home Financials for this Owner
Home Financials are based on the most recent Mortgage that was taken out on this home.
Original Mortgage
$8,750
Interest Rate
8.9%
Mortgage Type
New Conventional
Purchase Details
Closed on
Sep 5, 2023
Sold by
Overton William Andrew
Bought by
Brown Jeffrey
Purchase Details
Closed on
Apr 26, 2013
Sold by
Overton William A and Kane William P
Bought by
Overton William A
Home Financials for this Owner
Home Financials are based on the most recent Mortgage that was taken out on this home.
Original Mortgage
$48,000
Interest Rate
3.64%
Mortgage Type
New Conventional
Purchase Details
Closed on
Aug 19, 2003
Sold by
Cooper E F
Bought by
W O Inc and William Kane Inc,
Create a Home Valuation Report for This Property
The Home Valuation Report is an in-depth analysis detailing your home's value as well as a comparison with similar homes in the area
Home Values in the Area
Average Home Value in this Area
Purchase History
| Date | Buyer | Sale Price | Title Company |
|---|---|---|---|
| Meads Landon | $250,000 | Fidelity National Title | |
| Meads Landon | $250,000 | Fidelity National Title | |
| Brown Jeffrey | $85,000 | Priority Title | |
| Brown Jeffrey | $85,000 | Priority Title | |
| Overton William A | $5,000 | -- | |
| W O Inc | $52,500 | -- |
Source: Public Records
Mortgage History
| Date | Status | Borrower | Loan Amount |
|---|---|---|---|
| Closed | Meads Landon | $8,750 | |
| Open | Meads Landon | $245,471 | |
| Closed | Meads Landon | $245,471 | |
| Previous Owner | Overton William A | $48,000 |
Source: Public Records
Tax History Compared to Growth
Tax History
| Year | Tax Paid | Tax Assessment Tax Assessment Total Assessment is a certain percentage of the fair market value that is determined by local assessors to be the total taxable value of land and additions on the property. | Land | Improvement |
|---|---|---|---|---|
| 2025 | $1,940 | $206,000 | $85,000 | $121,000 |
| 2024 | $1,940 | $192,100 | $80,000 | $112,100 |
| 2023 | $1,133 | $121,400 | $70,000 | $51,400 |
| 2022 | $1,104 | $109,300 | $60,000 | $49,300 |
| 2021 | $1,099 | $104,700 | $55,000 | $49,700 |
| 2020 | $1,083 | $103,100 | $55,000 | $48,100 |
| 2019 | $1,047 | $99,700 | $55,000 | $44,700 |
| 2018 | $1,070 | $101,900 | $55,000 | $46,900 |
| 2017 | $1,051 | $100,100 | $55,000 | $45,100 |
| 2016 | $1,037 | $98,800 | $55,000 | $43,800 |
| 2015 | $1,037 | $98,800 | $55,000 | $43,800 |
| 2014 | $1,037 | $98,800 | $55,000 | $43,800 |
Source: Public Records
Map
Nearby Homes
- 1232 Stewart St
- 1300 Bainbridge Blvd
- 1319 Decatur St
- 1119 Decatur St
- 801 Poindexter St Unit 314
- 1116 Rodgers St
- 1016 Thoroughgood Way Unit 101
- 1016 Thoroughgood Way Unit 307
- 1016 Thoroughgood Way Unit 104
- 1016 Thoroughgood Way Unit 100
- 1016 Thoroughgood Way Unit 201
- 1007 Holly Ave
- 1120 Porter St
- 1308 Chesapeake Ave
- 1001 Decatur St
- 1305 Chesapeake Ave
- 1347 Chesapeake Ave
- 1138 Seaboard Ave
- 833 Wilbur Ave
- 1546 Jackson Ave