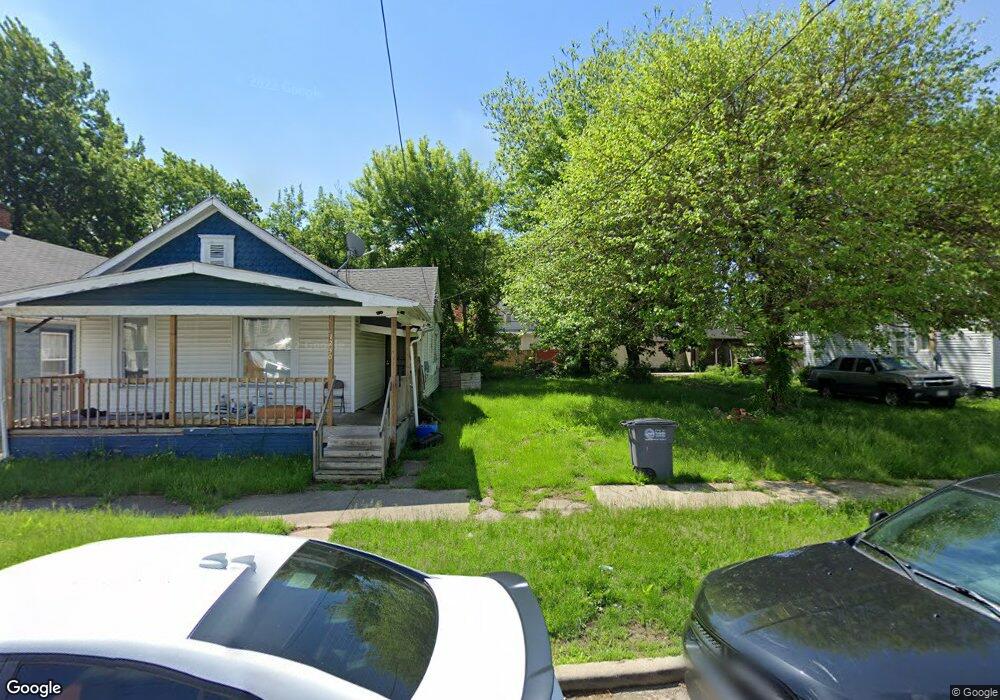
1231 Moore St Toledo, OH 43608
Lagrange NeighborhoodEstimated Value: $54,000 - $66,000
3
Beds
1
Bath
1,492
Sq Ft
$39/Sq Ft
Est. Value
About This Home
This home is located at 1231 Moore St, Toledo, OH 43608 and is currently estimated at $58,409, approximately $39 per square foot. 1231 Moore St is a home located in Lucas County with nearby schools including Spring Elementary School, Woodward High School, and Imagine Environmental Science Academy.
Ownership History
Date
Name
Owned For
Owner Type
Purchase Details
Closed on
Apr 27, 2017
Sold by
Mays Annie
Bought by
Raymond Mays
Current Estimated Value
Purchase Details
Closed on
Jun 24, 2016
Sold by
Mays H G
Bought by
Annie Mays
Create a Home Valuation Report for This Property
The Home Valuation Report is an in-depth analysis detailing your home's value as well as a comparison with similar homes in the area
Home Values in the Area
Average Home Value in this Area
Purchase History
| Date | Buyer | Sale Price | Title Company |
|---|---|---|---|
| Raymond Mays | -- | -- | |
| Annie Mays | -- | -- |
Source: Public Records
Tax History
| Year | Tax Paid | Tax Assessment Tax Assessment Total Assessment is a certain percentage of the fair market value that is determined by local assessors to be the total taxable value of land and additions on the property. | Land | Improvement |
|---|---|---|---|---|
| 2025 | $3,914 | $14,315 | $2,030 | $12,285 |
| 2024 | $3,913 | $14,315 | $2,030 | $12,285 |
| 2023 | $337 | $12,285 | $1,680 | $10,605 |
| 2022 | $362 | $12,285 | $1,680 | $10,605 |
| 2021 | $358 | $12,285 | $1,680 | $10,605 |
| 2020 | $869 | $10,360 | $1,400 | $8,960 |
| 2019 | $863 | $10,360 | $1,400 | $8,960 |
| 2018 | $845 | $10,360 | $1,400 | $8,960 |
| 2017 | $3,227 | $10,115 | $1,365 | $8,750 |
| 2016 | $2,772 | $28,900 | $3,900 | $25,000 |
| 2015 | $841 | $28,900 | $3,900 | $25,000 |
| 2014 | $129 | $10,120 | $1,370 | $8,750 |
| 2013 | $86 | $10,120 | $1,370 | $8,750 |
Source: Public Records
Map
Nearby Homes
Your Personal Tour Guide
Ask me questions while you tour the home.