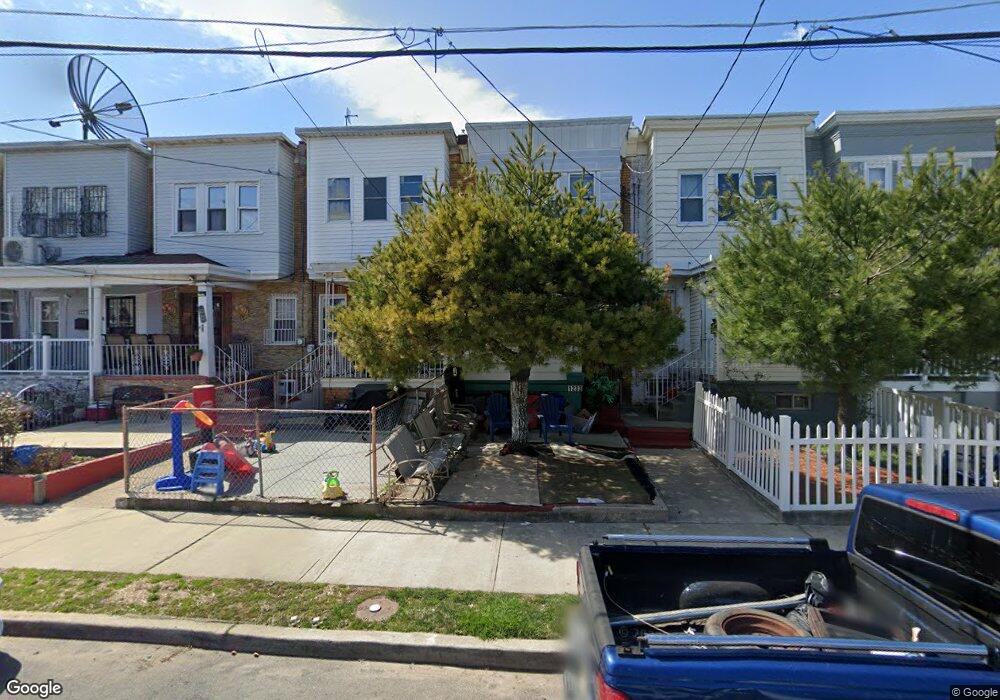
1231 N 21st St Camden, NJ 08105
Cramer Hill NeighborhoodEstimated Value: $128,184 - $217,000
--
Bed
--
Bath
1,040
Sq Ft
$148/Sq Ft
Est. Value
About This Home
This home is located at 1231 N 21st St, Camden, NJ 08105 and is currently estimated at $154,296, approximately $148 per square foot. 1231 N 21st St is a home located in Camden County with nearby schools including Veterans Memorial Middle School, Eastside High School, and Camdens Promise Charter School.
Ownership History
Date
Name
Owned For
Owner Type
Purchase Details
Closed on
Jul 21, 2015
Sold by
Fernandez Solanyi
Bought by
Pichardo Edy A
Current Estimated Value
Home Financials for this Owner
Home Financials are based on the most recent Mortgage that was taken out on this home.
Original Mortgage
$85,424
Interest Rate
4.25%
Mortgage Type
FHA
Purchase Details
Closed on
May 18, 2010
Sold by
Fortuna Leonidas A
Bought by
Fernandez Solanyi
Create a Home Valuation Report for This Property
The Home Valuation Report is an in-depth analysis detailing your home's value as well as a comparison with similar homes in the area
Home Values in the Area
Average Home Value in this Area
Purchase History
| Date | Buyer | Sale Price | Title Company |
|---|---|---|---|
| Pichardo Edy A | $87,000 | Access Abstract Corp | |
| Fernandez Solanyi | -- | -- |
Source: Public Records
Mortgage History
| Date | Status | Borrower | Loan Amount |
|---|---|---|---|
| Previous Owner | Pichardo Edy A | $85,424 |
Source: Public Records
Tax History Compared to Growth
Tax History
| Year | Tax Paid | Tax Assessment Tax Assessment Total Assessment is a certain percentage of the fair market value that is determined by local assessors to be the total taxable value of land and additions on the property. | Land | Improvement |
|---|---|---|---|---|
| 2025 | $2,353 | $66,400 | $16,800 | $49,600 |
| 2024 | $2,274 | $66,400 | $16,800 | $49,600 |
| 2023 | $2,274 | $66,400 | $16,800 | $49,600 |
| 2022 | $2,232 | $66,400 | $16,800 | $49,600 |
| 2021 | $2,224 | $66,400 | $16,800 | $49,600 |
| 2020 | $2,112 | $66,400 | $16,800 | $49,600 |
| 2019 | $2,022 | $66,400 | $16,800 | $49,600 |
| 2018 | $2,011 | $66,400 | $16,800 | $49,600 |
| 2017 | $1,962 | $66,400 | $16,800 | $49,600 |
| 2016 | $1,900 | $66,400 | $16,800 | $49,600 |
| 2015 | $1,829 | $66,400 | $16,800 | $49,600 |
| 2014 | $1,785 | $66,400 | $16,800 | $49,600 |
Source: Public Records
Map
Nearby Homes