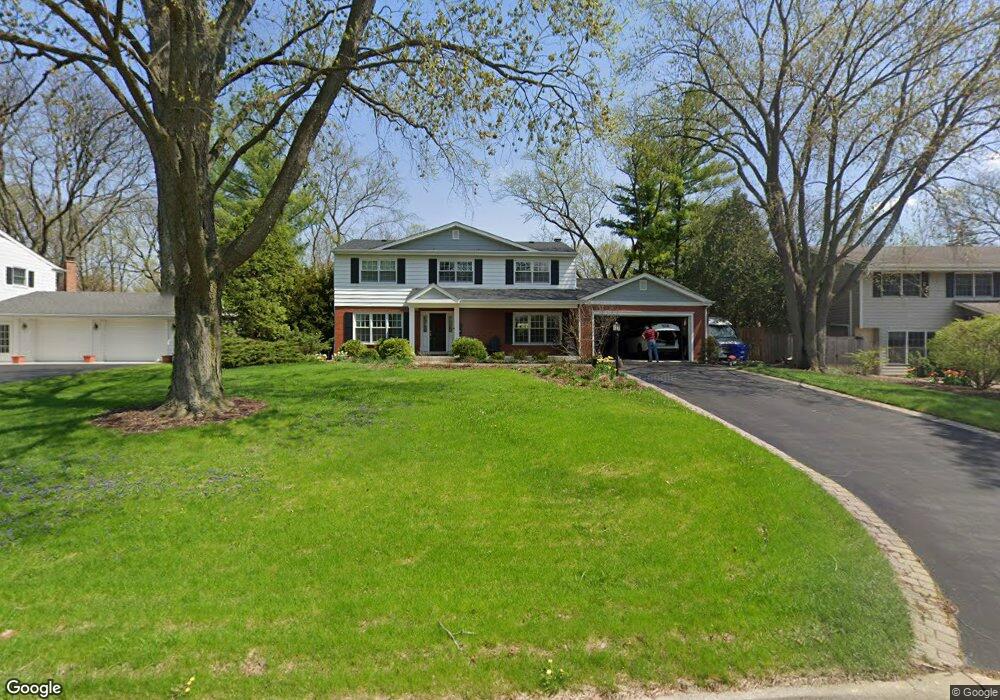
1231 S Main St Wheaton, IL 60189
Southeast Wheaton NeighborhoodEstimated Value: $660,710 - $797,000
2
Beds
3
Baths
2,590
Sq Ft
$285/Sq Ft
Est. Value
About This Home
This home is located at 1231 S Main St, Wheaton, IL 60189 and is currently estimated at $738,928, approximately $285 per square foot. 1231 S Main St is a home located in DuPage County with nearby schools including Whittier Elementary School, Edison Middle School, and Wheaton Warrenville South High School.
Ownership History
Date
Name
Owned For
Owner Type
Purchase Details
Closed on
Apr 23, 2017
Sold by
Field Denise M
Bought by
Field James M
Current Estimated Value
Purchase Details
Closed on
Nov 8, 2002
Sold by
Rossol James J and Rossol Evelyn L
Bought by
Field James and Field Denise
Home Financials for this Owner
Home Financials are based on the most recent Mortgage that was taken out on this home.
Original Mortgage
$300,000
Outstanding Balance
$114,994
Interest Rate
4.87%
Mortgage Type
Purchase Money Mortgage
Estimated Equity
$623,934
Create a Home Valuation Report for This Property
The Home Valuation Report is an in-depth analysis detailing your home's value as well as a comparison with similar homes in the area
Home Values in the Area
Average Home Value in this Area
Purchase History
We collect this data history from publicly available records. To have your information removed, we recommend requesting removal directly through your county’s website.
| Date | Buyer | Sale Price | Title Company |
|---|---|---|---|
| Field James M | -- | None Available | |
| Field James | $430,000 | Koenig & Strey Title |
Source: Public Records
Mortgage History
We collect this data history from publicly available records. To have your information removed, we recommend requesting removal directly through your county’s website.
| Date | Status | Borrower | Loan Amount |
|---|---|---|---|
| Open | Field James | $300,000 |
Source: Public Records
Tax History
| Year | Tax Paid | Tax Assessment Tax Assessment Total Assessment is a certain percentage of the fair market value that is determined by local assessors to be the total taxable value of land and additions on the property. | Land | Improvement |
|---|---|---|---|---|
| 2024 | $11,053 | $187,491 | $46,226 | $141,265 |
| 2023 | $10,582 | $172,580 | $42,550 | $130,030 |
| 2022 | $10,533 | $163,090 | $40,210 | $122,880 |
| 2021 | $10,490 | $159,220 | $39,260 | $119,960 |
| 2020 | $10,454 | $157,730 | $38,890 | $118,840 |
| 2019 | $10,206 | $153,560 | $37,860 | $115,700 |
| 2018 | $11,713 | $167,710 | $35,680 | $132,030 |
| 2017 | $11,542 | $161,520 | $34,360 | $127,160 |
| 2016 | $11,394 | $155,070 | $32,990 | $122,080 |
| 2015 | $11,313 | $147,940 | $31,470 | $116,470 |
| 2014 | $10,833 | $139,610 | $30,420 | $109,190 |
| 2013 | $10,554 | $140,030 | $30,510 | $109,520 |
Source: Public Records
Map
Nearby Homes
- 116 E Farnham Ln
- 110 E Farnham Ln
- 909 S Wheaton Ave
- 715 S Naperville Rd
- 1205 S Chase St
- 521 S Naperville Rd
- 1209 Fischer St
- 629 W Elm St
- 520 S Wheaton Ave
- 522 S West St
- 419 W Evergreen St
- 890 Sheldon Ct Unit D
- 607 E Evergreen St
- 517 Renn Ct
- 323 S Hale St
- 1021 Greenwood Dr
- 1541 Brittany Ct
- 1015 E Lowden Ave
- 170 Shelley Ln
- 1018 Dawes Ave
Your Personal Tour Guide
Ask me questions while you tour the home.