1231 Water Front Rd Unit 523 Greensboro, GA 30642
Estimated Value: $491,000 - $558,000
3
Beds
2
Baths
2,050
Sq Ft
$252/Sq Ft
Est. Value
About This Home
This home is located at 1231 Water Front Rd Unit 523, Greensboro, GA 30642 and is currently estimated at $516,571, approximately $251 per square foot. 1231 Water Front Rd Unit 523 is a home located in Greene County with nearby schools including Greene County High School, Lake Oconee Academy Elementary, and Lake Oconee Academy High School.
Ownership History
Date
Name
Owned For
Owner Type
Purchase Details
Closed on
Aug 16, 2019
Sold by
Koppelmann Frederick John
Bought by
Lloyd Wood W
Current Estimated Value
Home Financials for this Owner
Home Financials are based on the most recent Mortgage that was taken out on this home.
Original Mortgage
$274,400
Outstanding Balance
$240,816
Interest Rate
3.8%
Mortgage Type
New Conventional
Estimated Equity
$275,755
Purchase Details
Closed on
Sep 1, 2016
Sold by
James R
Bought by
Koppelmann Frederick John and Koppelmann Anne Bessent
Purchase Details
Closed on
Feb 23, 2010
Sold by
Pulte Home Corporation
Bought by
Laskey Joyce and Laskey James R
Purchase Details
Closed on
May 12, 2008
Sold by
Vintage Communites Inc
Bought by
Pulte Home Corp
Purchase Details
Closed on
Feb 16, 2007
Sold by
Linger Longer Dev Co
Bought by
Vintage Communites Inc
Create a Home Valuation Report for This Property
The Home Valuation Report is an in-depth analysis detailing your home's value as well as a comparison with similar homes in the area
Home Values in the Area
Average Home Value in this Area
Purchase History
| Date | Buyer | Sale Price | Title Company |
|---|---|---|---|
| Lloyd Wood W | $343,000 | -- | |
| Koppelmann Frederick John | $348,500 | -- | |
| Laskey Joyce | $342,444 | -- | |
| Pulte Home Corp | $2,719,600 | -- | |
| Vintage Communites Inc | $10,359,500 | -- |
Source: Public Records
Mortgage History
| Date | Status | Borrower | Loan Amount |
|---|---|---|---|
| Open | Lloyd Wood W | $274,400 |
Source: Public Records
Tax History Compared to Growth
Tax History
| Year | Tax Paid | Tax Assessment Tax Assessment Total Assessment is a certain percentage of the fair market value that is determined by local assessors to be the total taxable value of land and additions on the property. | Land | Improvement |
|---|---|---|---|---|
| 2024 | $2,194 | $185,360 | $44,000 | $141,360 |
| 2023 | $2,453 | $183,640 | $44,000 | $139,640 |
| 2022 | $2,453 | $172,520 | $35,200 | $137,320 |
| 2021 | $2,597 | $148,080 | $35,200 | $112,880 |
| 2020 | $2,852 | $141,240 | $34,000 | $107,240 |
| 2019 | $3,194 | $141,240 | $34,000 | $107,240 |
| 2018 | $2,957 | $141,240 | $34,000 | $107,240 |
| 2017 | $2,947 | $139,339 | $34,000 | $105,339 |
| 2016 | $2,497 | $139,339 | $34,000 | $105,339 |
| 2015 | $2,439 | $139,338 | $34,000 | $105,339 |
| 2014 | $2,472 | $131,963 | $40,000 | $91,963 |
Source: Public Records
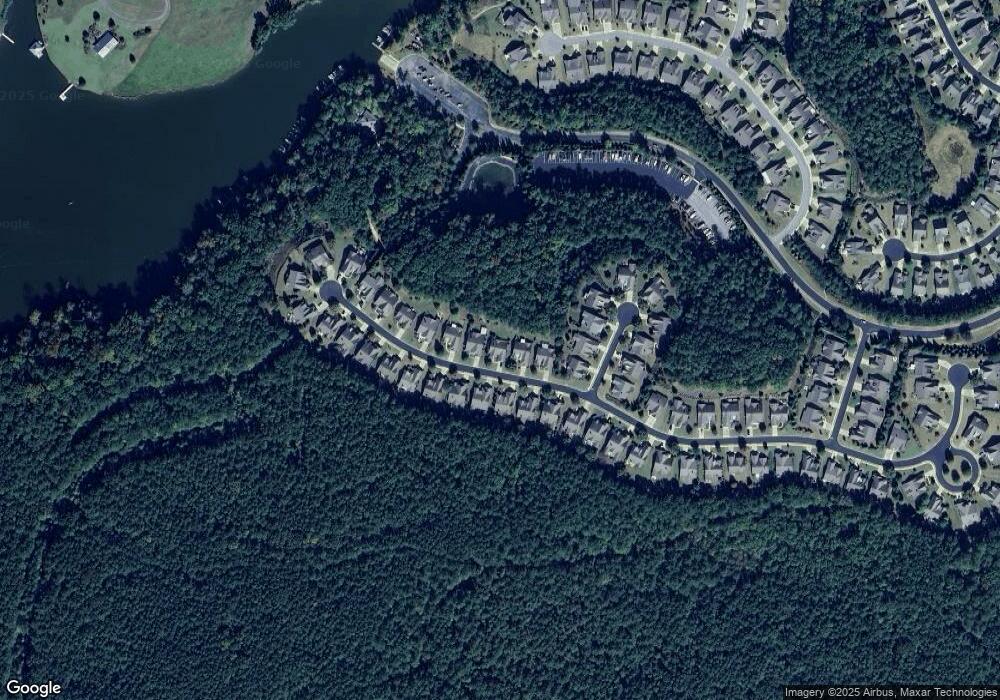
Map
Nearby Homes
- 1231 Water Front Rd
- 1241 Water Front Rd
- 1221 Water Front Rd
- 1221 Water Front R Unit 522
- 1211 Water Front Rd
- 1251 Water Front Rd
- 1230 Water Front Rd
- 1220 Water Front Rd
- 1240 Water Front Rd
- 1210 Water Front Rd
- 1250 Water Front Rd
- 1000 Delconee Place
- 1200 Water Front Rd
- 1200 Water Front Rd Unit 544
- 1010 Delconee Place
- 1281 Water Front Rd
- 0 Water Front Rd Unit 7401517
- 0 Water Front Rd Unit 7156947
- 0 Water Front Rd Unit 7046664
- 0 Water Front Rd Unit 3215379