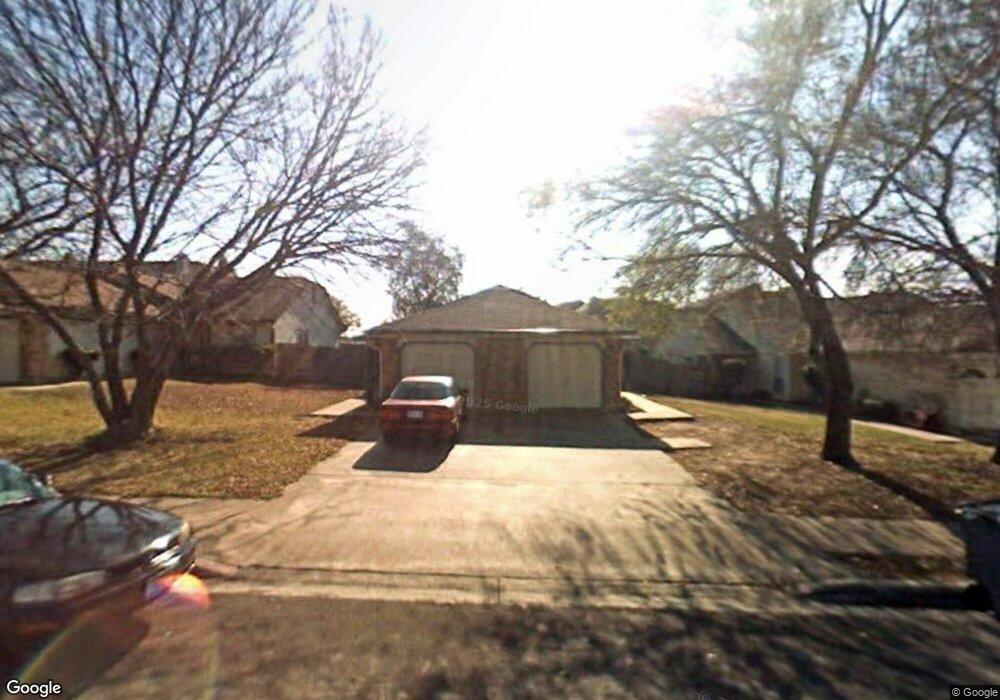
12315 Patron Dr Unit A Austin, TX 78758
Walnut Creek Park NeighborhoodEstimated Value: $477,000 - $546,000
2
Beds
2
Baths
1,777
Sq Ft
$288/Sq Ft
Est. Value
About This Home
This home is located at 12315 Patron Dr Unit A, Austin, TX 78758 and is currently estimated at $511,550, approximately $287 per square foot. 12315 Patron Dr Unit A is a home located in Travis County with nearby schools including Pillow Elementary School, Burnet Middle School, and Anderson High School.
Ownership History
Date
Name
Owned For
Owner Type
Purchase Details
Closed on
May 15, 2023
Sold by
Mai Qu En and Trang Khanh
Bought by
Q & Tk Mai Trust
Current Estimated Value
Purchase Details
Closed on
Oct 14, 2004
Sold by
Vu Long and Hoang Ann Tu
Bought by
Mai Quyen and Mai Trang Khanh
Home Financials for this Owner
Home Financials are based on the most recent Mortgage that was taken out on this home.
Original Mortgage
$124,000
Interest Rate
5.82%
Mortgage Type
Purchase Money Mortgage
Purchase Details
Closed on
Dec 20, 2001
Sold by
Vu Long
Bought by
Hoang Ann Tu
Purchase Details
Closed on
Mar 13, 2000
Sold by
Custom Plumbing Company Inc
Bought by
Vu Long
Home Financials for this Owner
Home Financials are based on the most recent Mortgage that was taken out on this home.
Original Mortgage
$108,000
Interest Rate
8.23%
Create a Home Valuation Report for This Property
The Home Valuation Report is an in-depth analysis detailing your home's value as well as a comparison with similar homes in the area
Home Values in the Area
Average Home Value in this Area
Purchase History
| Date | Buyer | Sale Price | Title Company |
|---|---|---|---|
| Q & Tk Mai Trust | -- | None Listed On Document | |
| Mai Quyen | -- | Chicago Title Insurance Comp | |
| Hoang Ann Tu | -- | -- | |
| Vu Long | -- | Gracy Title Company |
Source: Public Records
Mortgage History
| Date | Status | Borrower | Loan Amount |
|---|---|---|---|
| Previous Owner | Mai Quyen | $124,000 | |
| Previous Owner | Vu Long | $108,000 | |
| Closed | Hoang Ann Tu | $0 |
Source: Public Records
Tax History Compared to Growth
Tax History
| Year | Tax Paid | Tax Assessment Tax Assessment Total Assessment is a certain percentage of the fair market value that is determined by local assessors to be the total taxable value of land and additions on the property. | Land | Improvement |
|---|---|---|---|---|
| 2025 | $10,436 | $466,359 | $130,779 | $335,580 |
| 2023 | $10,436 | $591,843 | $125,000 | $466,843 |
| 2022 | $10,390 | $526,078 | $125,000 | $401,078 |
| 2021 | $8,439 | $387,715 | $125,000 | $262,715 |
| 2020 | $6,691 | $311,966 | $125,000 | $186,966 |
| 2018 | $6,676 | $301,531 | $125,000 | $176,531 |
| 2017 | $5,673 | $254,392 | $75,000 | $179,392 |
| 2016 | $4,781 | $214,360 | $60,000 | $154,360 |
| 2015 | $4,111 | $190,187 | $40,000 | $150,187 |
| 2014 | $4,111 | $172,762 | $40,000 | $132,762 |
Source: Public Records
Map
Nearby Homes
- 12323 Alderbrook Dr
- 12319 Emery Oaks Rd
- 12307 Marogot Run
- 12336 Limerick Ave
- 12166 Metric Blvd Unit 233
- 12166 Metric Blvd Unit 2003
- 12166 Metric Blvd Unit 219
- 12166 Metric Blvd Unit 2008
- 12166 Metric Blvd Unit 103
- 12166 Metric Blvd Unit 2011
- 12166 Metric Blvd Unit 257
- 12166 Metric Blvd Unit 141
- 12166 Metric Blvd Unit 230
- 12166 Metric Blvd Unit 238
- 12166 Metric Blvd Unit 2014
- 12166 Metric Blvd Unit 213
- 12320 Cedarspur Rd
- 2109 Brandywine Ln
- 12500 Lamppost Ln Unit 16
- 1708 Shag Bark Trail
- 12315 Patron Dr Unit B
- 12315 Patron Dr
- 12313 Patron Dr Unit B
- 12313 Patron Dr
- 12317 Patron Dr Unit B
- 12317 Patron Dr Unit A
- 12317 Patron Dr
- 12311 Patron Dr Unit A
- 12311 Patron Dr Unit B
- 12311 Patron Dr
- 12319 Patron Dr
- 12301 Dellrey Dr
- 12301 Dellrey Dr Unit B
- 12320 Patron Dr
- 12320 Patron Dr Unit A
- 12309 Patron Dr
- 12309 Patron Dr Unit A
- 12321 Patron Dr Unit A
- 12321 Patron Dr Unit B
- 12321 Patron Dr