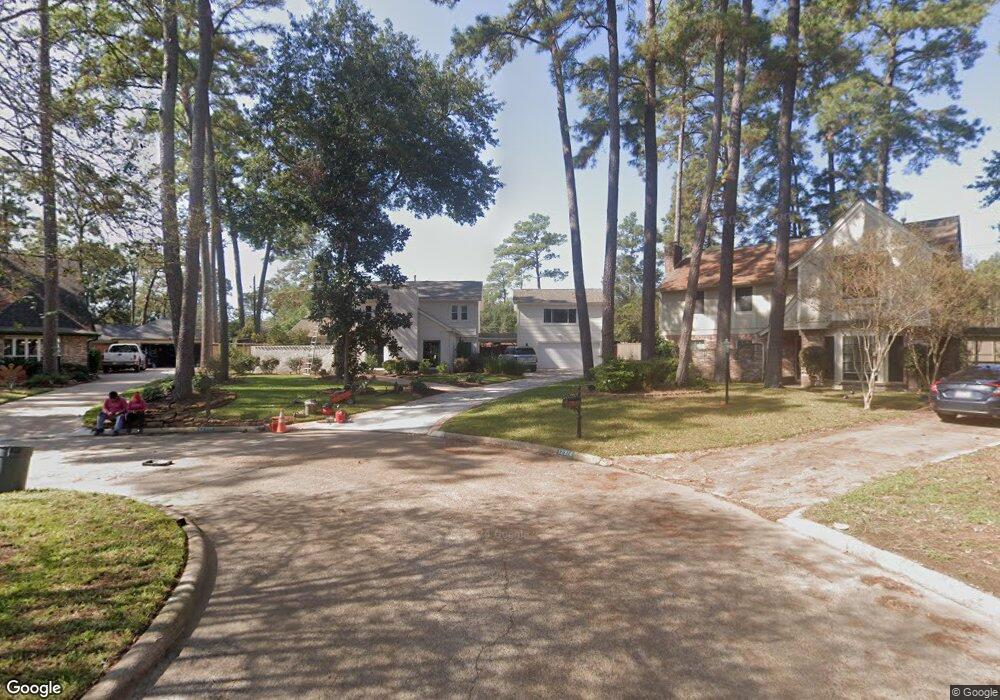
12319 Oak Park Cir Houston, TX 77070
Estimated Value: $303,797 - $331,000
4
Beds
2
Baths
2,333
Sq Ft
$136/Sq Ft
Est. Value
About This Home
This home is located at 12319 Oak Park Cir, Houston, TX 77070 and is currently estimated at $318,449, approximately $136 per square foot. 12319 Oak Park Cir is a home located in Harris County with nearby schools including Hamilton Elementary School, Hamilton Middle School, and Cypress Creek High School.
Ownership History
Date
Name
Owned For
Owner Type
Purchase Details
Closed on
Oct 15, 2024
Sold by
Clark Katherine E
Bought by
Clark Ronald J
Current Estimated Value
Purchase Details
Closed on
Dec 16, 2016
Sold by
Eric L Whaley
Bought by
Clark Katherine and Clark Ronald
Home Financials for this Owner
Home Financials are based on the most recent Mortgage that was taken out on this home.
Original Mortgage
$100,000
Interest Rate
4.16%
Purchase Details
Closed on
Jan 20, 2003
Sold by
Hartwell Joe D and Hartwell Bonnie S
Bought by
Clark Ronald J and Clark Katherine E
Home Financials for this Owner
Home Financials are based on the most recent Mortgage that was taken out on this home.
Original Mortgage
$69,715
Interest Rate
6%
Mortgage Type
Seller Take Back
Purchase Details
Closed on
Jul 15, 1994
Sold by
Teague Gaines C and Teague Christine R
Bought by
Hartwell Joe D and Hartwell Bonnie S
Create a Home Valuation Report for This Property
The Home Valuation Report is an in-depth analysis detailing your home's value as well as a comparison with similar homes in the area
Home Values in the Area
Average Home Value in this Area
Purchase History
| Date | Buyer | Sale Price | Title Company |
|---|---|---|---|
| Clark Ronald J | -- | None Listed On Document | |
| Clark Katherine | -- | -- | |
| Clark Ronald J | -- | -- | |
| Hartwell Joe D | -- | Stewart Title |
Source: Public Records
Mortgage History
| Date | Status | Borrower | Loan Amount |
|---|---|---|---|
| Previous Owner | Clark Katherine | $100,000 | |
| Previous Owner | Clark Katherine | -- | |
| Previous Owner | Clark Ronald J | $69,715 |
Source: Public Records
Tax History Compared to Growth
Tax History
| Year | Tax Paid | Tax Assessment Tax Assessment Total Assessment is a certain percentage of the fair market value that is determined by local assessors to be the total taxable value of land and additions on the property. | Land | Improvement |
|---|---|---|---|---|
| 2025 | $4,179 | $281,701 | $86,156 | $195,545 |
| 2024 | $4,179 | $277,587 | $86,156 | $191,431 |
| 2023 | $4,179 | $296,198 | $86,156 | $210,042 |
| 2022 | $5,706 | $264,502 | $66,164 | $198,338 |
| 2021 | $5,466 | $216,931 | $66,164 | $150,767 |
| 2020 | $5,260 | $202,369 | $51,408 | $150,961 |
| 2019 | $5,690 | $210,807 | $51,408 | $159,399 |
| 2018 | $1,981 | $203,241 | $51,408 | $151,833 |
| 2017 | $5,204 | $203,241 | $51,408 | $151,833 |
| 2016 | $4,731 | $176,894 | $39,508 | $137,386 |
| 2015 | $3,499 | $176,894 | $39,508 | $137,386 |
| 2014 | $3,499 | $165,608 | $30,464 | $135,144 |
Source: Public Records
Map
Nearby Homes
- 12402 Malcomson Rd
- 12303 Christy Mill Ct
- 14915 Rain Shadow Ct
- 12911 Forest Meadow Dr
- 14826 N Eldridge Pkwy
- 15002 Carols Way Dr
- 12219 Rocky Lake Ct
- 12854 Highland Hills Dr
- 12120 Silver Creek Dr
- 12915 Hunterfield Dr
- 12923 Hunterfield Dr
- 12810 Forest Meadow Dr
- 14703 Forest Lodge Dr
- 12610 Ivyforest Dr
- 51 Wincrest Falls Dr
- 12511 Oakcroft Dr
- 14918 Shady Bend Dr
- 15519 Hermitage Oaks Dr
- 15415 Kenny Dr
- 12126 Normont Dr
- 12315 Oak Park Cir
- 12314 Oak Park Cir
- 12311 Oak Park Cir
- 15026 Rain Shadow Ct
- 15022 Rain Shadow Ct
- 12306 Oak Park Cir
- 12307 Oak Park Cir
- 12315 Christy Mill Ct
- 15018 Rain Shadow Ct
- 12311 Christy Mill Ct
- 15027 Rain Shadow Ct
- 12302 Oak Park Cir
- 12307 Christy Mill Ct
- 15014 Rain Shadow Ct
- 12303 Oak Park Cir
- 12318 Oak Park Dr
- 15023 Rain Shadow Ct
- 15010 Rain Shadow Ct
- 15019 Rain Shadow Ct
- 12307 Oak Park Dr