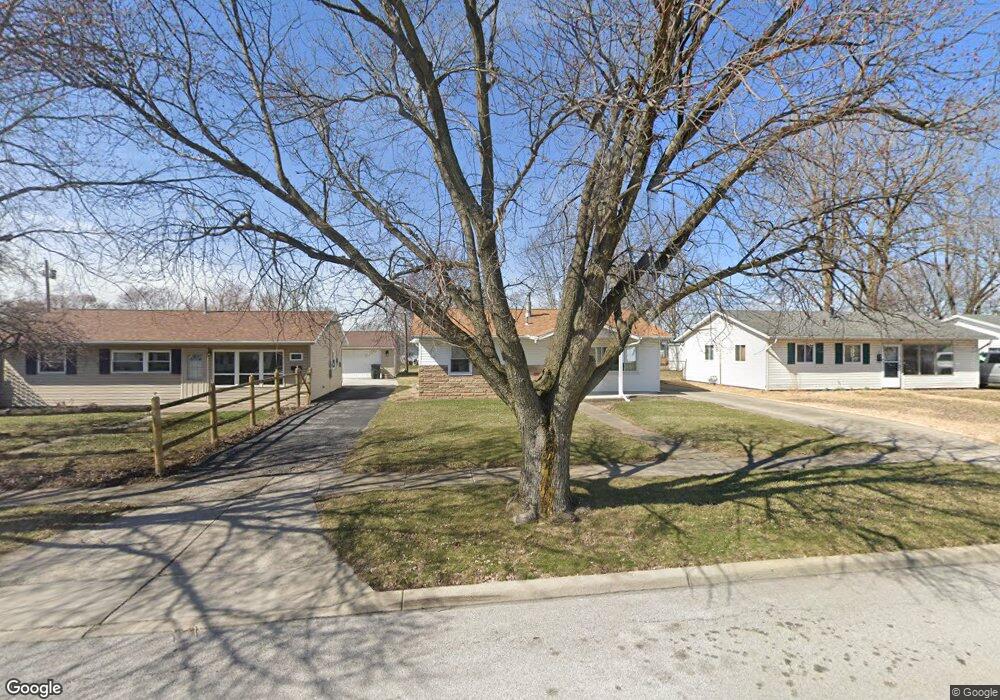
1232 Bernard Ave Findlay, OH 45840
Estimated Value: $156,000 - $172,000
2
Beds
1
Bath
1,249
Sq Ft
$133/Sq Ft
Est. Value
About This Home
This home is located at 1232 Bernard Ave, Findlay, OH 45840 and is currently estimated at $166,676, approximately $133 per square foot. 1232 Bernard Ave is a home located in Hancock County with nearby schools including Whittier Primary School, Bigelow Hill Elementary School, and Glenwood Middle School.
Ownership History
Date
Name
Owned For
Owner Type
Purchase Details
Closed on
Nov 19, 2020
Sold by
Meagley Harry Dean
Bought by
Temple Julie A and Meagley David M
Current Estimated Value
Purchase Details
Closed on
Sep 15, 1998
Sold by
Coale Randel
Bought by
Meagley H Dean
Home Financials for this Owner
Home Financials are based on the most recent Mortgage that was taken out on this home.
Original Mortgage
$6,500
Interest Rate
7.06%
Mortgage Type
New Conventional
Purchase Details
Closed on
Jul 28, 1997
Sold by
Bower Sandra
Bought by
Coale Randal
Home Financials for this Owner
Home Financials are based on the most recent Mortgage that was taken out on this home.
Original Mortgage
$50,000
Interest Rate
7.81%
Mortgage Type
New Conventional
Purchase Details
Closed on
Dec 1, 1987
Bought by
Bower Sandra K
Purchase Details
Closed on
Sep 28, 1984
Bought by
Miller Mark D and Miller Linda J
Create a Home Valuation Report for This Property
The Home Valuation Report is an in-depth analysis detailing your home's value as well as a comparison with similar homes in the area
Home Values in the Area
Average Home Value in this Area
Purchase History
| Date | Buyer | Sale Price | Title Company |
|---|---|---|---|
| Temple Julie A | -- | None Available | |
| Meagley H Dean | $65,000 | -- | |
| Coale Randal | $66,500 | -- | |
| Bower Sandra K | $37,000 | -- | |
| Miller Mark D | $36,000 | -- |
Source: Public Records
Mortgage History
| Date | Status | Borrower | Loan Amount |
|---|---|---|---|
| Closed | Meagley H Dean | $6,500 | |
| Previous Owner | Coale Randal | $50,000 |
Source: Public Records
Tax History Compared to Growth
Tax History
| Year | Tax Paid | Tax Assessment Tax Assessment Total Assessment is a certain percentage of the fair market value that is determined by local assessors to be the total taxable value of land and additions on the property. | Land | Improvement |
|---|---|---|---|---|
| 2024 | $1,495 | $42,090 | $4,390 | $37,700 |
| 2023 | $1,498 | $42,090 | $4,390 | $37,700 |
| 2022 | $1,492 | $42,090 | $4,390 | $37,700 |
| 2021 | $1,345 | $33,040 | $4,390 | $28,650 |
| 2020 | $1,345 | $33,040 | $4,390 | $28,650 |
| 2019 | $969 | $33,040 | $4,390 | $28,650 |
| 2018 | $868 | $28,730 | $3,820 | $24,910 |
| 2017 | $869 | $28,730 | $3,820 | $24,910 |
| 2016 | $867 | $28,730 | $3,820 | $24,910 |
| 2015 | $669 | $24,040 | $3,820 | $20,220 |
| 2014 | $669 | $24,040 | $3,820 | $20,220 |
| 2012 | $675 | $24,040 | $3,820 | $20,220 |
Source: Public Records
Map
Nearby Homes
- 1216 Concord Ct
- 1062 Vincent St
- 1736 Woodridge Crescent
- 1450 Fostoria Ave
- 716 Winfield Ave
- 1010 Brenda Ct
- 3 Ohio 12
- 0 Ohio 12
- 1 Ohio 12
- 4 Ohio 12
- 2 Ohio 12
- 1865 Breckenridge Rd
- 0 Sheridan Ave
- 1474 Southwood Ave
- 1928 Deer Ridge Dr
- 1928 Deer Ridge Dr Unit L-133
- 1018 Cherry Ln
- 1641 Cherry Ln
- 715 Christina Ct
- 0 Romick Pkwy Unit 6131435
- 1236 Bernard Ave
- 1228 Bernard Ave
- 1240 Bernard Ave
- 1224 Bernard Ave
- 1229 Concord Ct
- 1233 Concord Ct
- 1225 Concord Ct
- 1300 Bernard Ave
- 1220 Bernard Ave
- 1237 Concord Ct
- 1233 Bernard Ave
- 1237 Bernard Ave
- 1229 Bernard Ave
- 1304 Bernard Ave
- 1216 Bernard Ave
- 1241 Bernard Ave
- 1225 Bernard Ave
- 1217 Concord Ct
- 1301 Bernard Ave
- 1221 Bernard Ave