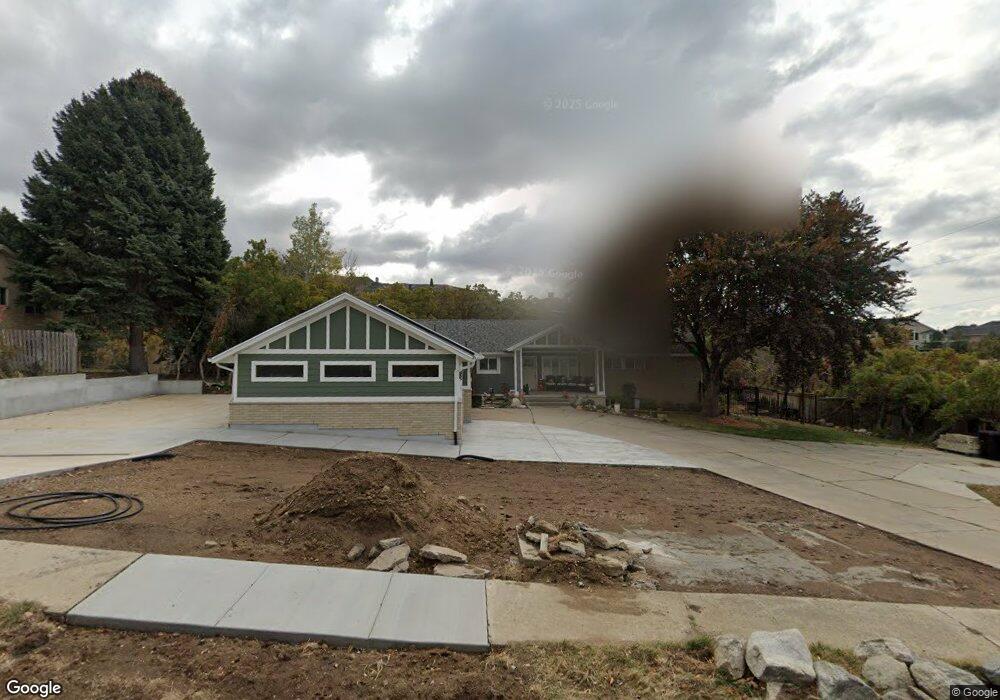
1232 E Millbrook Way Bountiful, UT 84010
Estimated Value: $766,000 - $831,960
5
Beds
4
Baths
3,985
Sq Ft
$201/Sq Ft
Est. Value
About This Home
This home is located at 1232 E Millbrook Way, Bountiful, UT 84010 and is currently estimated at $799,740, approximately $200 per square foot. 1232 E Millbrook Way is a home located in Davis County with nearby schools including Oak Hills School, Millcreek Junior High School, and Bountiful High School.
Ownership History
Date
Name
Owned For
Owner Type
Purchase Details
Closed on
Jun 8, 2020
Sold by
Spilker Byron M and Spilker Deon
Bought by
Spilker Byron Melvin and Spilker Deon J
Current Estimated Value
Home Financials for this Owner
Home Financials are based on the most recent Mortgage that was taken out on this home.
Original Mortgage
$193,000
Outstanding Balance
$134,688
Interest Rate
3.2%
Mortgage Type
New Conventional
Estimated Equity
$665,052
Purchase Details
Closed on
Jan 7, 2014
Sold by
Spilker Byron M and Spilker Deon J
Bought by
The Byron & Deon Spilker Trust
Purchase Details
Closed on
Jun 21, 2012
Sold by
Miller Alton H and Miller Judy B
Bought by
Spilker Bryon M and Spilker Deon J
Home Financials for this Owner
Home Financials are based on the most recent Mortgage that was taken out on this home.
Original Mortgage
$309,776
Interest Rate
2.75%
Mortgage Type
New Conventional
Create a Home Valuation Report for This Property
The Home Valuation Report is an in-depth analysis detailing your home's value as well as a comparison with similar homes in the area
Purchase History
| Date | Buyer | Sale Price | Title Company |
|---|---|---|---|
| Spilker Byron Melvin | -- | Accommodation | |
| Spilker Byron M | -- | Title One Inc | |
| The Byron & Deon Spilker Trust | -- | Title One Inc | |
| Spilker Bryon M | -- | North American Title |
Source: Public Records
Mortgage History
| Date | Status | Borrower | Loan Amount |
|---|---|---|---|
| Open | Spilker Byron M | $193,000 | |
| Closed | Spilker Bryon M | $309,776 |
Source: Public Records
Tax History
| Year | Tax Paid | Tax Assessment Tax Assessment Total Assessment is a certain percentage of the fair market value that is determined by local assessors to be the total taxable value of land and additions on the property. | Land | Improvement |
|---|---|---|---|---|
| 2025 | $4,629 | $407,550 | $207,084 | $200,466 |
| 2024 | $4,306 | $391,050 | $189,543 | $201,507 |
| 2023 | $4,285 | $710,000 | $362,272 | $347,728 |
| 2022 | $4,311 | $391,600 | $195,583 | $196,017 |
| 2021 | $3,713 | $516,000 | $292,347 | $223,653 |
| 2020 | $3,113 | $429,000 | $265,767 | $163,233 |
| 2019 | $3,014 | $404,000 | $221,946 | $182,054 |
| 2018 | $2,843 | $374,000 | $211,217 | $162,783 |
| 2016 | $2,353 | $166,485 | $80,552 | $85,933 |
| 2015 | $2,314 | $154,495 | $80,552 | $73,943 |
| 2014 | $2,330 | $161,317 | $80,552 | $80,765 |
| 2013 | -- | $136,851 | $73,574 | $63,277 |
Source: Public Records
Map
Nearby Homes
- 1087 Arlington Way
- 1785 1450 E Unit 604
- 1475 Mueller Park Rd
- 861 E Millbrook Way
- 795 Abby Ln Unit 5
- 1596 E Millbrook Way
- 1735 S Temple Ct Unit 203
- 771 E 1825 S
- 2136 Elaine Dr
- 1987 Mapleview Dr
- 631 E 1700 S
- 1820 S High Pointe Dr
- 1997 S 800 E
- 0 Lot Bountiful Blvd
- 842 E 2150 S
- 1886 S Jeri Dr
- 438 E 1800 S
- 380 E 1500 S
- 1878 E Ridge Point Dr
- 626 E 2150 S
- 1208 Millbridge Ln
- 1210 E Millbrook Way
- 1269 E Millbrook Way
- 1196 E Millbrook Way
- 1384 Canyon Crest Dr
- 1381 Oakridge Ln
- 1294 E Millbrook Way
- 1271 E Millbrook Way
- 1341 Oakridge Ln
- 1186 E Millbrook Way
- 1338 Canyon Crest Dr
- 1295 E Millbrook Way
- 1296 E Millbrook Way
- 1339 Canyon Crest Dr
- 1180 E Millbrook Way
- 1325 Oakridge Ln
- 1356 Oakridge Ln
- 1289 Canyon Crest Dr
- 1288 Canyon Crest Dr
- 1298 E Millbrook Way
Your Personal Tour Guide
Ask me questions while you tour the home.