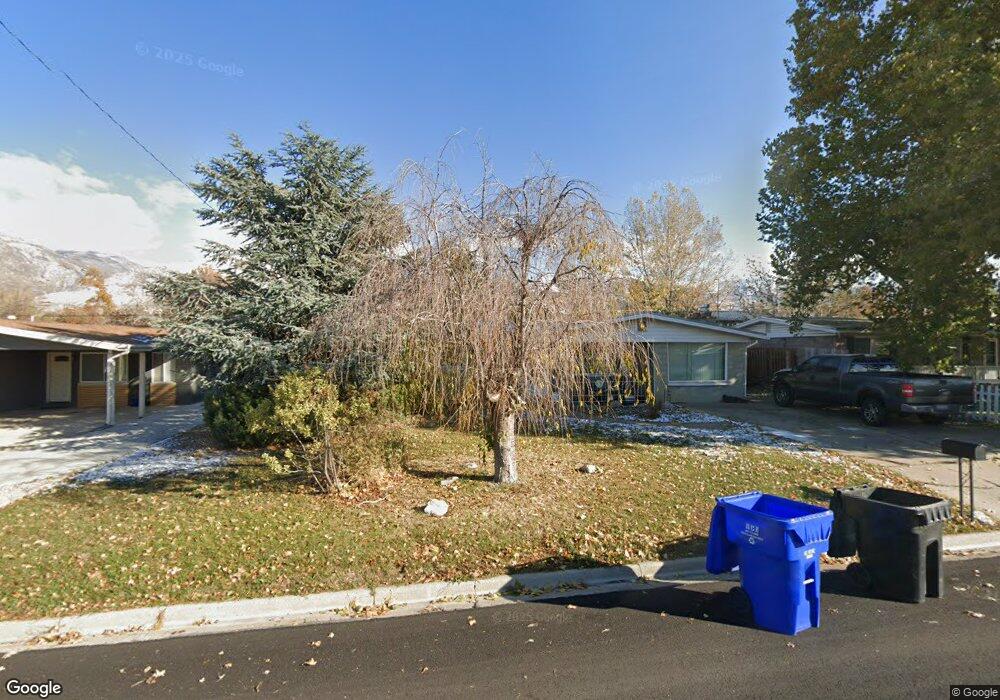
1232 N 250 W Bountiful, UT 84010
Estimated Value: $451,000 - $492,000
3
Beds
2
Baths
1,531
Sq Ft
$307/Sq Ft
Est. Value
About This Home
This home is located at 1232 N 250 W, Bountiful, UT 84010 and is currently estimated at $469,991, approximately $306 per square foot. 1232 N 250 W is a home located in Davis County with nearby schools including Meadowbrook Elementary School, Bountiful Junior High School, and Viewmont High School.
Ownership History
Date
Name
Owned For
Owner Type
Purchase Details
Closed on
May 25, 2005
Sold by
Sanford Elbert Keith and Sanford Shanna Lea
Bought by
Wilson Shane D
Current Estimated Value
Home Financials for this Owner
Home Financials are based on the most recent Mortgage that was taken out on this home.
Original Mortgage
$147,584
Outstanding Balance
$76,951
Interest Rate
5.84%
Mortgage Type
FHA
Estimated Equity
$393,040
Purchase Details
Closed on
Apr 26, 2000
Sold by
Cropper Leora C
Bought by
Sanford Elbert Keith and Sanford Shanna Lea
Purchase Details
Closed on
Jan 7, 1997
Sold by
Christensen Linda C
Bought by
Cropper Leora C
Purchase Details
Closed on
Dec 20, 1996
Sold by
Cropper Leora C and Kurt Christensen H
Bought by
Cropper Leora C and Christensen Linda C
Purchase Details
Closed on
Jan 31, 1996
Sold by
Fsla Prudential
Bought by
Johnson E T and Johnson Mary
Create a Home Valuation Report for This Property
The Home Valuation Report is an in-depth analysis detailing your home's value as well as a comparison with similar homes in the area
Home Values in the Area
Average Home Value in this Area
Purchase History
| Date | Buyer | Sale Price | Title Company |
|---|---|---|---|
| Wilson Shane D | -- | First American Title | |
| Sanford Elbert Keith | -- | First American Title Co | |
| Cropper Leora C | -- | -- | |
| Cropper Leora C | -- | -- | |
| Johnson E T | -- | Merrill Title Company |
Source: Public Records
Mortgage History
| Date | Status | Borrower | Loan Amount |
|---|---|---|---|
| Open | Wilson Shane D | $147,584 |
Source: Public Records
Tax History Compared to Growth
Tax History
| Year | Tax Paid | Tax Assessment Tax Assessment Total Assessment is a certain percentage of the fair market value that is determined by local assessors to be the total taxable value of land and additions on the property. | Land | Improvement |
|---|---|---|---|---|
| 2025 | $2,549 | $231,550 | $119,363 | $112,187 |
| 2024 | $2,385 | $225,501 | $103,065 | $122,436 |
| 2023 | $2,570 | $393,000 | $192,972 | $200,028 |
| 2022 | $2,362 | $208,451 | $106,288 | $102,163 |
| 2021 | $2,038 | $292,000 | $138,956 | $153,044 |
| 2020 | $1,852 | $258,000 | $119,846 | $138,154 |
| 2019 | $1,824 | $256,000 | $134,649 | $121,351 |
| 2018 | $1,799 | $233,000 | $132,691 | $100,309 |
| 2016 | $1,386 | $103,070 | $52,919 | $50,151 |
| 2015 | $1,404 | $94,600 | $52,919 | $41,681 |
| 2014 | $1,393 | $101,000 | $52,919 | $48,081 |
| 2013 | -- | $93,001 | $36,190 | $56,811 |
Source: Public Records
Map
Nearby Homes
- 1260 N 200 W
- 235 W 1400 N
- 366 W 1000 N
- 184 Park Shadows Cir
- Hampton Traditional Plan at Belmont Farms
- 1503 N 300 W
- 106 W 700 N
- 790 N 500 W
- 553 N 200 W
- 93 W 700 N
- 499 N 200 W Unit 30
- 499 N 200 W Unit 19
- 1520 N 550 W
- 96 Village Square Rd
- 239 Lyman Ln
- 215 Lyman Ln
- 234 Leah Cir
- 204 Lyman Ln
- 399 W 400 N Unit 47
- 140 E 650 N