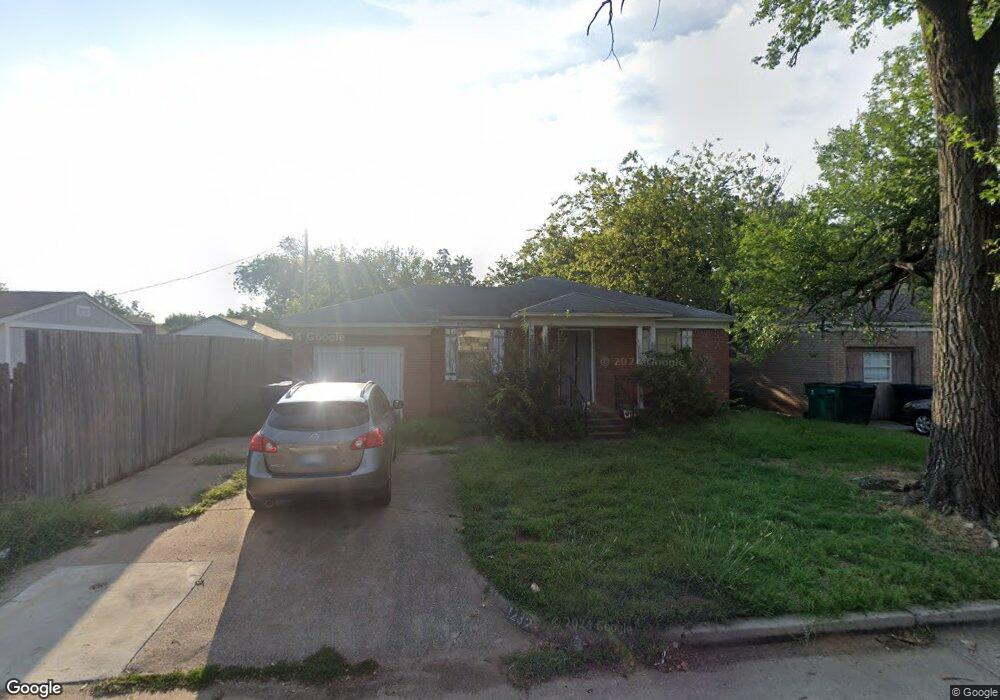
1232 N Independence Ave Oklahoma City, OK 73107
Linwood Place NeighborhoodEstimated Value: $122,049 - $155,000
2
Beds
1
Bath
908
Sq Ft
$145/Sq Ft
Est. Value
About This Home
This home is located at 1232 N Independence Ave, Oklahoma City, OK 73107 and is currently estimated at $132,012, approximately $145 per square foot. 1232 N Independence Ave is a home located in Oklahoma County with nearby schools including Mark Twain Elementary School, Taft Middle School, and Northwest Classen High School.
Ownership History
Date
Name
Owned For
Owner Type
Purchase Details
Closed on
Sep 27, 2024
Sold by
Donna Weatherford Revocable Living Trust and Weatherford Donna Kathleen
Bought by
Sherman Justin and Sherman Kelly
Current Estimated Value
Purchase Details
Closed on
Feb 2, 2021
Sold by
Donna Weatherford Revocable Living Trust
Bought by
Bernardy Greg
Purchase Details
Closed on
Jun 12, 2019
Sold by
Weatherford Donna Kathleen
Bought by
Donna Weatherford Revocable Living Trust
Purchase Details
Closed on
Mar 19, 2010
Sold by
Weatherford John and Weatherford Donna Kathleen
Bought by
Weatherford John and Weatherford Donna Kathleen
Home Financials for this Owner
Home Financials are based on the most recent Mortgage that was taken out on this home.
Original Mortgage
$11,000
Interest Rate
4.93%
Mortgage Type
New Conventional
Purchase Details
Closed on
Jun 19, 2009
Sold by
Bernardy Gregory Alan
Bought by
Watherford Donna Kathleen
Create a Home Valuation Report for This Property
The Home Valuation Report is an in-depth analysis detailing your home's value as well as a comparison with similar homes in the area
Home Values in the Area
Average Home Value in this Area
Purchase History
| Date | Buyer | Sale Price | Title Company |
|---|---|---|---|
| Sherman Justin | $40,000 | First American Title | |
| Bernardy Greg | -- | None Listed On Document | |
| Donna Weatherford Revocable Living Trust | -- | None Available | |
| Donna Weatherford Revocable Living Trust | -- | None Available | |
| Weatherford John | -- | None Available | |
| Watherford Donna Kathleen | -- | None Available |
Source: Public Records
Mortgage History
| Date | Status | Borrower | Loan Amount |
|---|---|---|---|
| Previous Owner | Weatherford John | $11,000 |
Source: Public Records
Tax History Compared to Growth
Tax History
| Year | Tax Paid | Tax Assessment Tax Assessment Total Assessment is a certain percentage of the fair market value that is determined by local assessors to be the total taxable value of land and additions on the property. | Land | Improvement |
|---|---|---|---|---|
| 2024 | $894 | $7,641 | $1,260 | $6,381 |
| 2023 | $894 | $7,277 | $1,300 | $5,977 |
| 2022 | $815 | $6,931 | $1,440 | $5,491 |
| 2021 | $777 | $6,601 | $1,664 | $4,937 |
| 2020 | $749 | $6,287 | $1,371 | $4,916 |
| 2019 | $713 | $5,988 | $1,420 | $4,568 |
| 2018 | $647 | $5,703 | $0 | $0 |
| 2017 | $615 | $5,430 | $1,412 | $4,018 |
| 2016 | $587 | $5,172 | $1,287 | $3,885 |
| 2015 | $564 | $4,926 | $1,355 | $3,571 |
| 2014 | $562 | $4,941 | $1,355 | $3,586 |
Source: Public Records
Map
Nearby Homes
- 3216 NW 14th St
- 3209 NW 14th St
- 3205 NW 14th St
- 3116 NW 12th St
- 1415 N Drexel Blvd
- 3405 NW 15th St
- 3326 NW 16th St
- 3132 NW 16th St
- 1521 N Drexel Blvd
- 3424 NW 16th St
- 3020 W Park Place
- 2938 NW 14th St
- 1819 N Woodward Ave
- 2933 W Park Place
- 2934 NW 15th St
- 2939 NW 15th St
- 3216 NW 19th St
- 3517 NW 16th St
- 3644 NW 13th St
- 2829 NW 12th St
- 1224 N Independence Ave
- 1228 N Independence Ave
- 1220 N Independence Ave
- 1216 N Independence Ave
- 1227 N Independence Ave
- 1233 N Independence Ave
- 1240 N Independence Ave
- 3233 NW Drexel Ct
- 3240 NW 12th St
- 1223 N Independence Ave
- 3229 NW Drexel Ct
- 3234 NW 12th St
- 3234 NW Drexel Ct
- 3300 NW 12th St
- 1208 N Independence Ave
- 1221 N Independence Ave
- 3230 NW 12th St
- 1204 N Independence Ave
- 3312 NW 12th St
- 3226 NW 12th St