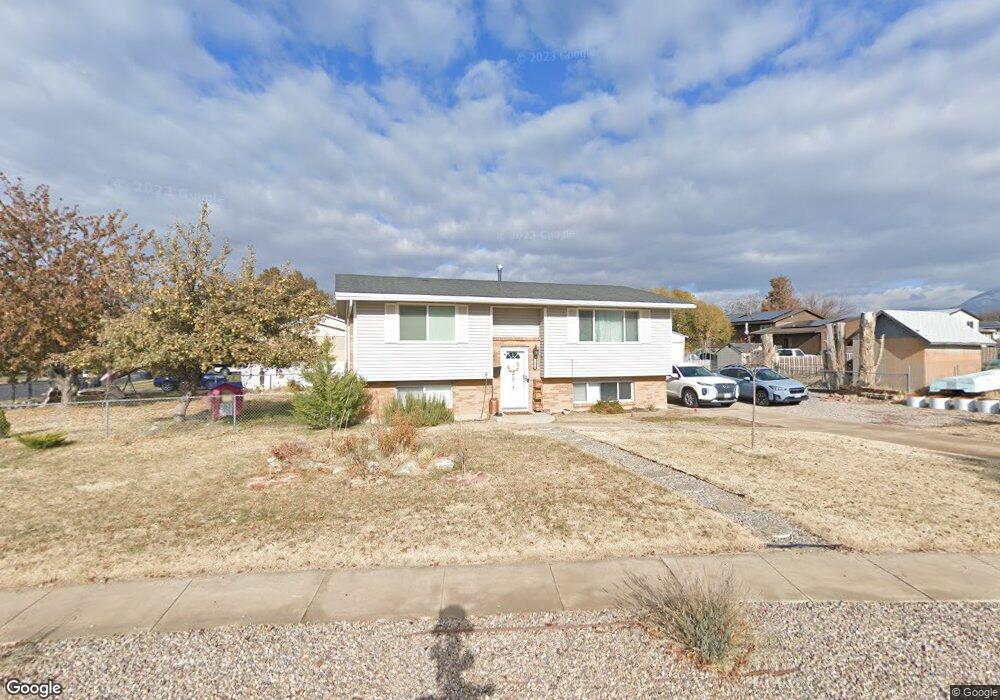
1232 W 2175 N Clearfield, UT 84015
Estimated Value: $406,000 - $456,000
4
Beds
2
Baths
1,944
Sq Ft
$221/Sq Ft
Est. Value
About This Home
This home is located at 1232 W 2175 N, Clearfield, UT 84015 and is currently estimated at $429,330, approximately $220 per square foot. 1232 W 2175 N is a home located in Davis County with nearby schools including Parkside Elementary School, Sunset Junior High School, and Clearfield High School.
Ownership History
Date
Name
Owned For
Owner Type
Purchase Details
Closed on
Oct 16, 2018
Sold by
Graham Thomas J
Bought by
Rodriguez Francisco E and Utami Yosephine D
Current Estimated Value
Home Financials for this Owner
Home Financials are based on the most recent Mortgage that was taken out on this home.
Original Mortgage
$213,400
Outstanding Balance
$185,714
Interest Rate
4.5%
Mortgage Type
New Conventional
Estimated Equity
$243,616
Purchase Details
Closed on
Oct 16, 2009
Sold by
Thompson Max D and Thompson Vici L
Bought by
Graham Thomas J
Home Financials for this Owner
Home Financials are based on the most recent Mortgage that was taken out on this home.
Original Mortgage
$140,563
Interest Rate
5.02%
Mortgage Type
FHA
Create a Home Valuation Report for This Property
The Home Valuation Report is an in-depth analysis detailing your home's value as well as a comparison with similar homes in the area
Home Values in the Area
Average Home Value in this Area
Purchase History
| Date | Buyer | Sale Price | Title Company |
|---|---|---|---|
| Rodriguez Francisco E | -- | First American Title Insuran | |
| Graham Thomas J | -- | Mountain View Title |
Source: Public Records
Mortgage History
| Date | Status | Borrower | Loan Amount |
|---|---|---|---|
| Open | Rodriguez Francisco E | $213,400 | |
| Previous Owner | Graham Thomas J | $140,563 |
Source: Public Records
Tax History Compared to Growth
Tax History
| Year | Tax Paid | Tax Assessment Tax Assessment Total Assessment is a certain percentage of the fair market value that is determined by local assessors to be the total taxable value of land and additions on the property. | Land | Improvement |
|---|---|---|---|---|
| 2025 | $2,237 | $215,050 | $93,543 | $121,507 |
| 2024 | $2,191 | $211,750 | $101,999 | $109,751 |
| 2023 | $1,834 | $328,000 | $117,498 | $210,502 |
| 2022 | $1,940 | $191,950 | $70,115 | $121,835 |
| 2021 | $1,894 | $278,000 | $90,763 | $187,237 |
| 2020 | $1,632 | $237,000 | $78,748 | $158,252 |
| 2019 | $1,593 | $226,000 | $89,028 | $136,972 |
| 2018 | $1,277 | $178,000 | $74,813 | $103,187 |
| 2016 | $1,093 | $78,650 | $29,466 | $49,184 |
| 2015 | $1,091 | $74,690 | $29,466 | $45,224 |
| 2014 | $931 | $64,750 | $29,466 | $35,284 |
| 2013 | -- | $69,201 | $25,444 | $43,757 |
Source: Public Records
Map
Nearby Homes