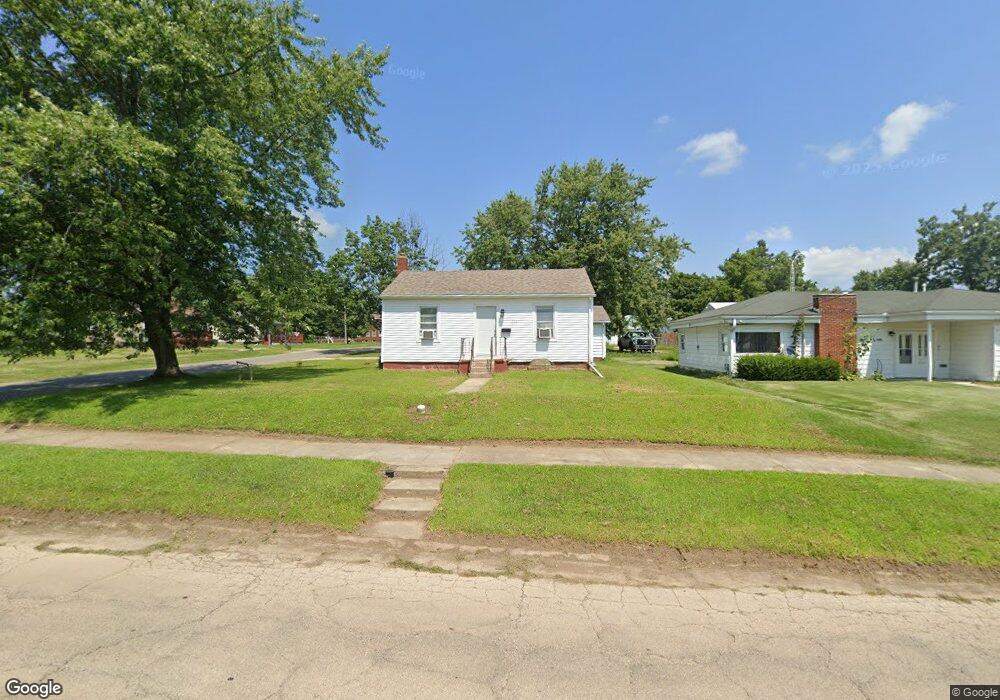
1232 W Prospect St Kewanee, IL 61443
Estimated Value: $45,366 - $66,000
2
Beds
--
Bath
672
Sq Ft
$77/Sq Ft
Est. Value
About This Home
This home is located at 1232 W Prospect St, Kewanee, IL 61443 and is currently estimated at $51,592, approximately $76 per square foot. 1232 W Prospect St is a home located in Henry County with nearby schools including Kewanee High School and Visitation Catholic School.
Ownership History
Date
Name
Owned For
Owner Type
Purchase Details
Closed on
Feb 23, 2023
Sold by
Duytschaver Michael
Bought by
Pereda Jose
Current Estimated Value
Purchase Details
Closed on
Aug 29, 2022
Sold by
Cernovich Randy L and Cernovich Jacqueline F
Bought by
Duytschaver Michael
Purchase Details
Closed on
Aug 25, 2020
Sold by
Neva Susan K and Raes Denna L
Bought by
Cemovich Randy L and Cemovich Jacqueline
Home Financials for this Owner
Home Financials are based on the most recent Mortgage that was taken out on this home.
Original Mortgage
$10,400
Interest Rate
6.85%
Mortgage Type
Future Advance Clause Open End Mortgage
Purchase Details
Closed on
Jun 30, 2016
Sold by
Longeville Lance A
Bought by
Longeville Lance A and Lance A Longeville Revocable Living Trus
Purchase Details
Closed on
Nov 7, 2012
Sold by
Laub Myron
Bought by
Neva Susan K and Lewis Patricia A
Create a Home Valuation Report for This Property
The Home Valuation Report is an in-depth analysis detailing your home's value as well as a comparison with similar homes in the area
Home Values in the Area
Average Home Value in this Area
Purchase History
| Date | Buyer | Sale Price | Title Company |
|---|---|---|---|
| Pereda Jose | $40,000 | -- | |
| Duytschaver Michael | $8,000 | Barash & Everett Llc | |
| Cemovich Randy L | $13,000 | Attorney | |
| Longeville Lance A | -- | None Available | |
| Neva Susan K | -- | None Available |
Source: Public Records
Mortgage History
| Date | Status | Borrower | Loan Amount |
|---|---|---|---|
| Previous Owner | Cemovich Randy L | $10,400 |
Source: Public Records
Tax History Compared to Growth
Tax History
| Year | Tax Paid | Tax Assessment Tax Assessment Total Assessment is a certain percentage of the fair market value that is determined by local assessors to be the total taxable value of land and additions on the property. | Land | Improvement |
|---|---|---|---|---|
| 2024 | $1,569 | $14,532 | $1,257 | $13,275 |
| 2023 | $760 | $12,860 | $1,112 | $11,748 |
| 2022 | $1,318 | $11,702 | $1,012 | $10,690 |
| 2021 | $1,260 | $10,835 | $937 | $9,898 |
| 2020 | $537 | $10,596 | $916 | $9,680 |
| 2019 | $576 | $11,056 | $956 | $10,100 |
| 2018 | $612 | $11,328 | $980 | $10,348 |
| 2017 | $593 | $11,182 | $967 | $10,215 |
| 2016 | $1,292 | $11,295 | $977 | $10,318 |
| 2015 | $1,346 | $11,107 | $961 | $10,146 |
| 2013 | $1,346 | $11,390 | $986 | $10,404 |
Source: Public Records
Map
Nearby Homes
- 703 S Washington St
- 201 S Grove St
- 516 W Prospect St
- 512 Commercial St
- 218 Ross St
- 402 W Prospect St
- 334 Rice St
- 716 W 3rd St
- 300 Beach St S
- 213 Elliott St
- 237 W Mill St
- 410 Ross St
- 216 Hillcrest Dr
- 235 S Chestnut St
- 323 S Chestnut St
- 622 S Tremont St
- 338 Hollis St
- 115 Roosevelt Ave
- 713 Henry St
- 206 Roosevelt Ave
- 1228 W Prospect St
- 1218 W Prospect St
- 1225 Roseview Ave
- 1221 Roseview Ave
- 1212 W Prospect St
- 1302 W Prospect St
- 409 S Adams St
- 1219 Roseview Ave
- 1305 W Prospect St
- 1303 W Prospect St
- 1215 Roseview Ave
- 1315 W Prospect St
- 1215 W Prospect St
- 1213 Roseview Ave
- 401 S Adams St
- 1319 W Prospect St
- 1310 W Prospect St
- 1210 W Prospect St
- 1213 W Prospect St
- 1309 Roseview Ave