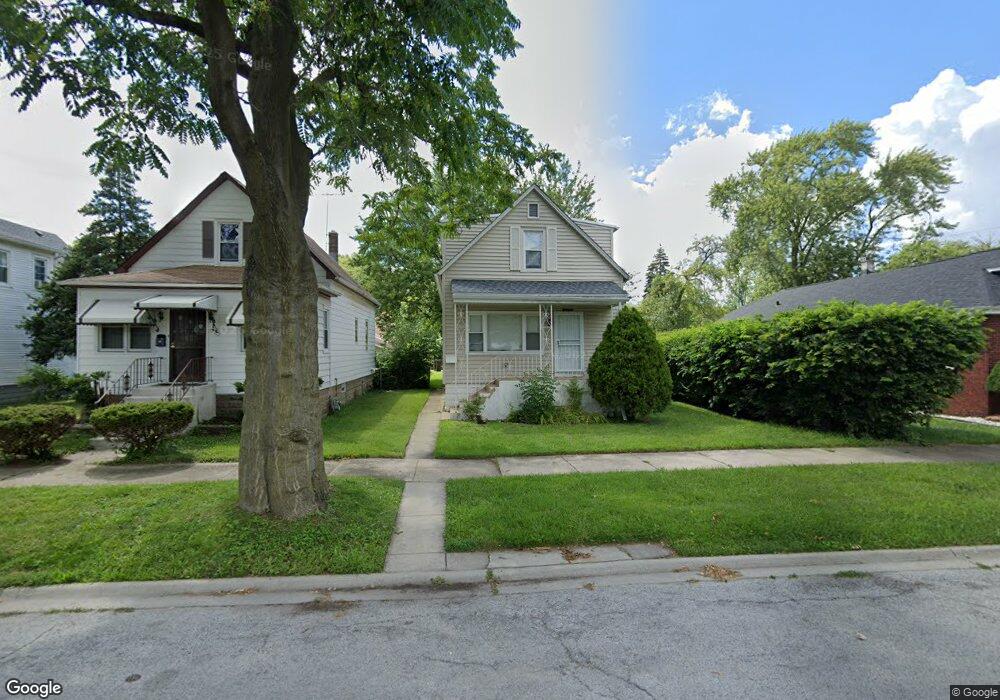
12320 S Morgan St Calumet Park, IL 60827
Estimated Value: $170,000 - $180,083
3
Beds
2
Baths
1,008
Sq Ft
$172/Sq Ft
Est. Value
About This Home
This home is located at 12320 S Morgan St, Calumet Park, IL 60827 and is currently estimated at $173,271, approximately $171 per square foot. 12320 S Morgan St is a home located in Cook County with nearby schools including Burr Oak Academy, Calumet Middle School, and Harold L. Richards High School.
Ownership History
Date
Name
Owned For
Owner Type
Purchase Details
Closed on
Aug 16, 2023
Sold by
Sibley Auto Spa & Detailing Inc
Bought by
Brilliant Blocks Inc
Current Estimated Value
Home Financials for this Owner
Home Financials are based on the most recent Mortgage that was taken out on this home.
Original Mortgage
$199,920
Outstanding Balance
$195,440
Interest Rate
6.9%
Mortgage Type
FHA
Estimated Equity
-$22,169
Purchase Details
Closed on
Aug 15, 2011
Sold by
Richardson Brenda
Bought by
Sibley Auto Spa & Detailing Inc Br
Purchase Details
Closed on
Mar 26, 2009
Sold by
Hsbc Mortgage Services Inc
Bought by
Richardson Brenda
Purchase Details
Closed on
Nov 27, 2007
Sold by
Davis
Bought by
Hsbc Mortgage Services Inc
Purchase Details
Closed on
Jul 3, 2002
Sold by
Davis Judith A
Bought by
Davis Stephen and Davis Judith A
Purchase Details
Closed on
Apr 21, 2000
Sold by
Lee Judith A and Davis Judith A
Bought by
Davis Judith A
Create a Home Valuation Report for This Property
The Home Valuation Report is an in-depth analysis detailing your home's value as well as a comparison with similar homes in the area
Home Values in the Area
Average Home Value in this Area
Purchase History
| Date | Buyer | Sale Price | Title Company |
|---|---|---|---|
| Brilliant Blocks Inc | -- | Old Republic Title | |
| Sibley Auto Spa & Detailing Inc Br | $27,000 | Fidelity National Title | |
| Richardson Brenda | $12,500 | None Available | |
| Hsbc Mortgage Services Inc | -- | None Available | |
| Davis Stephen | -- | Residential Title Services | |
| Davis Judith A | -- | Residential Title Services |
Source: Public Records
Mortgage History
| Date | Status | Borrower | Loan Amount |
|---|---|---|---|
| Open | Brilliant Blocks Inc | $199,920 |
Source: Public Records
Tax History Compared to Growth
Tax History
| Year | Tax Paid | Tax Assessment Tax Assessment Total Assessment is a certain percentage of the fair market value that is determined by local assessors to be the total taxable value of land and additions on the property. | Land | Improvement |
|---|---|---|---|---|
| 2024 | $6,034 | $12,000 | $3,375 | $8,625 |
| 2023 | $4,599 | $12,000 | $3,375 | $8,625 |
| 2022 | $4,599 | $7,160 | $2,953 | $4,207 |
| 2021 | $4,434 | $7,159 | $2,953 | $4,206 |
| 2020 | $4,361 | $7,159 | $2,953 | $4,206 |
| 2019 | $5,207 | $9,115 | $2,671 | $6,444 |
| 2018 | $5,290 | $9,115 | $2,671 | $6,444 |
| 2017 | $5,100 | $9,115 | $2,671 | $6,444 |
| 2016 | $5,039 | $9,443 | $2,390 | $7,053 |
| 2015 | $4,831 | $9,443 | $2,390 | $7,053 |
| 2014 | $4,888 | $9,443 | $2,390 | $7,053 |
| 2013 | $4,227 | $9,469 | $2,390 | $7,079 |
Source: Public Records
Map
Nearby Homes
- 12324 S Morgan St
- 12328 S Carpenter St
- 12401 S Carpenter St
- 12250 S Aberdeen St
- 12216 S Carpenter St
- 12416 S Carpenter St
- 12328 S Peoria St
- 12312 S May St
- 12420 S Aberdeen St
- 12327 S Peoria St
- 12402 S Green St
- 12226 S Elizabeth St
- 12321 S Halsted St
- 12130 S Racine Ave
- 12219 S Throop St
- 12324 S Emerald Ave
- 1301 W 123rd St
- 12437 S Throop St
- 12138 S Elizabeth St
- 12100 S Halsted St
- 12316 S Morgan St
- 12322 S Morgan St
- 12314 S Morgan St
- 12328 S Morgan St
- 12319 S Carpenter St
- 12317 S Carpenter St
- 12321 S Carpenter St
- 12313 S Carpenter St
- 12330 S Morgan St
- 12330 S Morgan St
- 12327 S Carpenter St
- 1005 W 123rd St
- 12329 S Carpenter St
- 12323 S Morgan St
- 1011 W 123rd St
- 1011 W 123rd St
- 12325 S Morgan St
- 12311 S Morgan St
- 12331 S Carpenter St
- 12334 S Morgan St