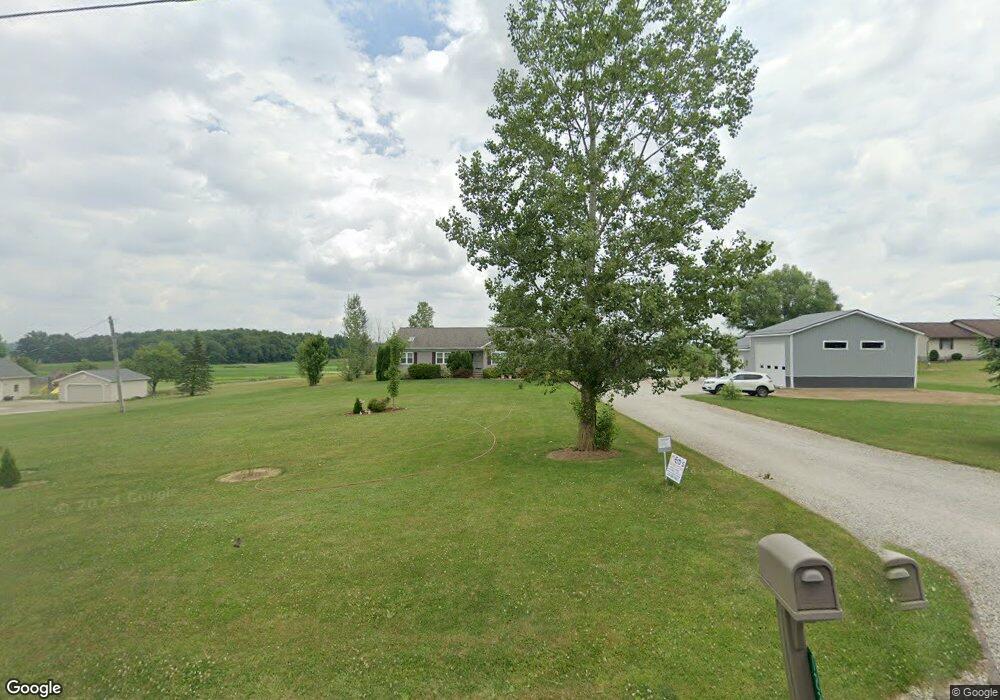
12321 Eby Rd Creston, OH 44217
Estimated Value: $319,317 - $427,000
3
Beds
2
Baths
1,498
Sq Ft
$242/Sq Ft
Est. Value
About This Home
This home is located at 12321 Eby Rd, Creston, OH 44217 and is currently estimated at $362,579, approximately $242 per square foot. 12321 Eby Rd is a home located in Wayne County with nearby schools including Norwayne Elementary School, Norwayne Middle School, and Norwayne High School.
Ownership History
Date
Name
Owned For
Owner Type
Purchase Details
Closed on
Aug 5, 1999
Sold by
Ferrise James D
Bought by
Wood Nick N and Wood Mary K
Current Estimated Value
Home Financials for this Owner
Home Financials are based on the most recent Mortgage that was taken out on this home.
Original Mortgage
$144,840
Outstanding Balance
$41,720
Interest Rate
7.68%
Mortgage Type
VA
Estimated Equity
$320,859
Purchase Details
Closed on
Apr 6, 1995
Sold by
Holcomb Richard D
Bought by
Ferrise James D and Ferrise Kimberly L
Home Financials for this Owner
Home Financials are based on the most recent Mortgage that was taken out on this home.
Original Mortgage
$120,250
Interest Rate
7.87%
Mortgage Type
New Conventional
Purchase Details
Closed on
Mar 17, 1994
Sold by
Graber Mary Jeanne
Bought by
Holcomb Richard D and Holcomb Miche
Purchase Details
Closed on
Nov 3, 1993
Sold by
Graber Mary Jeanne
Bought by
Graber Mary Jeanne
Create a Home Valuation Report for This Property
The Home Valuation Report is an in-depth analysis detailing your home's value as well as a comparison with similar homes in the area
Purchase History
| Date | Buyer | Sale Price | Title Company |
|---|---|---|---|
| Wood Nick N | $142,000 | -- | |
| Ferrise James D | $129,900 | -- | |
| Holcomb Richard D | $28,000 | -- | |
| Graber Mary Jeanne | -- | -- |
Source: Public Records
Mortgage History
| Date | Status | Borrower | Loan Amount |
|---|---|---|---|
| Open | Wood Nick N | $144,840 | |
| Previous Owner | Ferrise James D | $120,250 |
Source: Public Records
Tax History
| Year | Tax Paid | Tax Assessment Tax Assessment Total Assessment is a certain percentage of the fair market value that is determined by local assessors to be the total taxable value of land and additions on the property. | Land | Improvement |
|---|---|---|---|---|
| 2024 | $4,147 | $95,020 | $25,190 | $69,830 |
| 2023 | $3,618 | $95,020 | $25,190 | $69,830 |
| 2022 | $2,838 | $71,440 | $18,940 | $52,500 |
| 2021 | $2,871 | $71,440 | $18,940 | $52,500 |
| 2020 | $2,889 | $71,440 | $18,940 | $52,500 |
| 2019 | $2,535 | $60,590 | $17,500 | $43,090 |
| 2018 | $2,516 | $60,590 | $17,500 | $43,090 |
| 2017 | $2,496 | $60,590 | $17,500 | $43,090 |
| 2016 | $2,373 | $57,700 | $16,660 | $41,040 |
| 2015 | $2,343 | $57,700 | $16,660 | $41,040 |
| 2014 | $2,292 | $57,700 | $16,660 | $41,040 |
| 2013 | $2,371 | $58,030 | $16,170 | $41,860 |
Source: Public Records
Map
Nearby Homes
- 6760 Spruce St
- 7389 Doylestown Rd
- 124 Garden St
- 104 Wayne Ave
- 210 Evergreen Dr
- 112 Brooklyn Ave
- 147 N Main St
- 150 N Main St
- 0 Burbank & Erie St
- 10368 Wooster Pike
- 20 Cherokee Ln
- 5913 Stuckey Rd
- 136 S Metzger Ave
- 9791 Hulbert Rd
- 2535 Fulton Rd
- 9623 Yoder Rd
- 356 Cardinal Dr
- 428 Overlook Dr
- 106 S 2nd St
- 96 W Ohio Ave
Your Personal Tour Guide
Ask me questions while you tour the home.