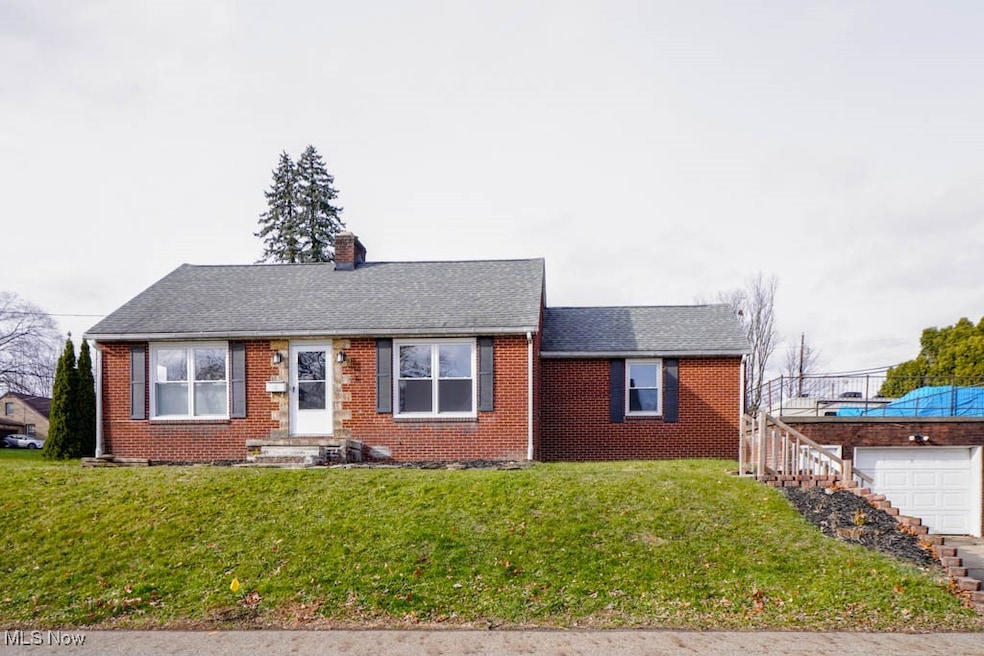
1233 29th St NE Canton, OH 44714
Colonial Heights NeighborhoodEstimated payment $926/month
Highlights
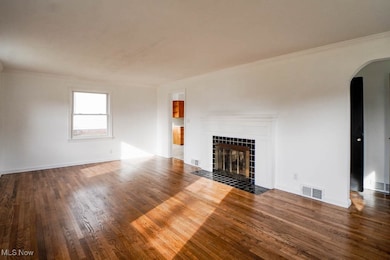
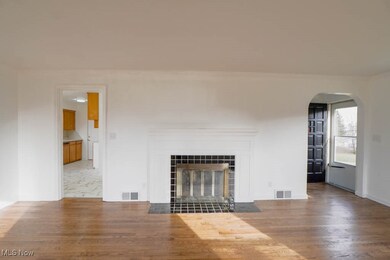
- Living Room with Fireplace
- Corner Lot
- 1 Car Attached Garage
- Frazer Elementary School Rated A-
- No HOA
- Patio
About This Home
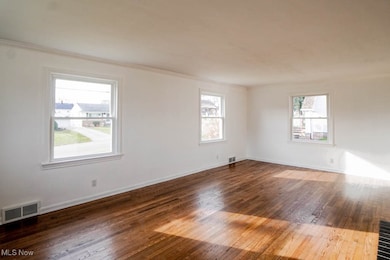
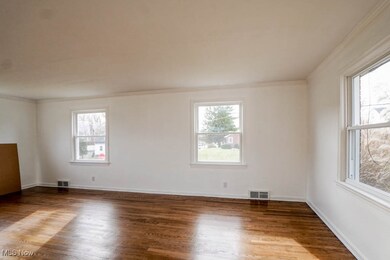
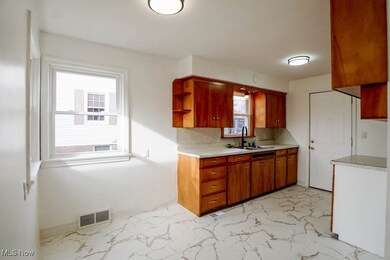
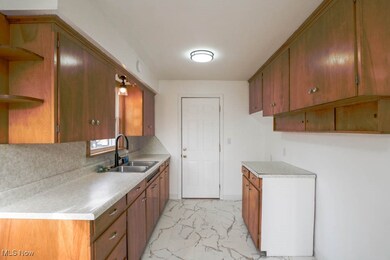
Lovely 2 bedroom brick bungalow featuring refinished hardwood floors and an inviting living room with a fireplace. The eat-in kitchen offers a cozy space for daily meals. Both bedrooms include hardwood flooring and bedroom 1 has 2 closets. The updated full bath features a new vanity, vanity lighting, and a tub/shower combo. The attic can double as a bonus room which provides additional living potential with laminate flooring and recessed lighting, a great option for a possible third bedroom.
The full, partially finished basement includes a rec room with a second fireplace, washer/dryer hookups, water softener, and has been waterproofed by All American Basements. Walkout access adds excellent potential for future finishing.
Outside, enjoy a fenced yard and a back patio perfect for relaxing or entertaining. The home also includes a 1 car attached garage with electric and convenient access to the basement. All new windows throughout add comfort and efficiency. A wonderful blend of character and opportunity!
Listing Agent
Keller Williams Legacy Group Realty Brokerage Email: Aaron@JoseSellsHomes.com License #2002013465 Listed on: 12/02/2025

Open House Schedule
-
Saturday, December 06, 202512:00 to 1:00 pm12/6/2025 12:00:00 PM +00:0012/6/2025 1:00:00 PM +00:00Add to Calendar
Home Details
Home Type
- Single Family
Est. Annual Taxes
- $1,644
Year Built
- Built in 1947
Lot Details
- 7,279 Sq Ft Lot
- Corner Lot
Parking
- 1 Car Attached Garage
Home Design
- Bungalow
- Brick Exterior Construction
- Fiberglass Roof
- Asphalt Roof
Interior Spaces
- 1,493 Sq Ft Home
- 1.5-Story Property
- Ceiling Fan
- Recessed Lighting
- Living Room with Fireplace
- 2 Fireplaces
Bedrooms and Bathrooms
- 3 Bedrooms | 2 Main Level Bedrooms
- 1 Full Bathroom
Unfinished Basement
- Basement Fills Entire Space Under The House
- Fireplace in Basement
- Laundry in Basement
Outdoor Features
- Patio
Utilities
- Forced Air Heating and Cooling System
- Heating System Uses Gas
Community Details
- No Home Owners Association
- Joseph D Millers Allotment 01 Subdivision
Listing and Financial Details
- Assessor Parcel Number 05208310
Map
Home Values in the Area
Average Home Value in this Area
Tax History
| Year | Tax Paid | Tax Assessment Tax Assessment Total Assessment is a certain percentage of the fair market value that is determined by local assessors to be the total taxable value of land and additions on the property. | Land | Improvement |
|---|---|---|---|---|
| 2025 | -- | $43,190 | $9,380 | $33,810 |
| 2024 | -- | $43,190 | $9,380 | $33,810 |
| 2023 | $1,415 | $30,350 | $7,980 | $22,370 |
| 2022 | $1,424 | $30,350 | $7,980 | $22,370 |
| 2021 | $1,674 | $30,350 | $7,980 | $22,370 |
| 2020 | $1,348 | $26,040 | $6,860 | $19,180 |
| 2019 | $1,337 | $26,040 | $6,860 | $19,180 |
| 2018 | $1,321 | $26,040 | $6,860 | $19,180 |
| 2017 | $1,372 | $24,850 | $7,560 | $17,290 |
| 2016 | $1,482 | $26,780 | $7,560 | $19,220 |
| 2015 | $1,433 | $26,780 | $7,560 | $19,220 |
| 2014 | $1,287 | $23,520 | $6,650 | $16,870 |
| 2013 | $629 | $23,520 | $6,650 | $16,870 |
Property History
| Date | Event | Price | List to Sale | Price per Sq Ft |
|---|---|---|---|---|
| 12/02/2025 12/02/25 | For Sale | $149,900 | -- | $100 / Sq Ft |
Purchase History
| Date | Type | Sale Price | Title Company |
|---|---|---|---|
| Warranty Deed | $89,000 | Attorney | |
| Quit Claim Deed | -- | -- | |
| Warranty Deed | $65,000 | Cta |
Mortgage History
| Date | Status | Loan Amount | Loan Type |
|---|---|---|---|
| Open | $89,000 | Purchase Money Mortgage | |
| Previous Owner | $59,500 | New Conventional | |
| Previous Owner | $58,500 | Purchase Money Mortgage |
Source: MLS Now
MLS Number: 5174841
APN: 05208310
Disclaimer: Certain information contained herein is derived from information provided by parties other than Homes.com. All information provided is deemed reliable, but is not guaranteed to be accurate and should be independently verified.
![]() IDX information is provided exclusively for personal, non-commercial use, and may not be used for any purpose other than to identify prospective properties consumers may be interested in purchasing. Information is deemed reliable but not guaranteed.
IDX information is provided exclusively for personal, non-commercial use, and may not be used for any purpose other than to identify prospective properties consumers may be interested in purchasing. Information is deemed reliable but not guaranteed.
- 000 Rowland Ave NE
- 1202 28th St NE
- 1306 Milford St NE
- 1321 Warrick Place NE
- 1115 Colonial Blvd NE
- 808 29th St NE
- 1220 25th St NE
- 708 29th St NE
- 1638 Warrick Place NE
- 2510 Gross Ave NE
- 2219 Rowland Ave NE
- 1227 33rd St NE
- 2315 Maple Ave NE
- 3321 Martindale Rd NE
- 1513 22nd St NE
- 2310 Maple Ave NE
- 908 22nd St NE
- 0 Rowland Ave NE Unit 5089960
- 1624 34th St NE
- 2028 Saint Elmo Ave NE
- 137 25th St NW
- 3600 Martindale Rd NE
- 1926 Market Ave N
- 3312 Middlebranch Ave NE
- 1833 Market Ave N
- 1807-104 Spring Ave NE
- 1736 Spring Ave NE
- 3013 Dennis Ct NE
- 123 17th St NW
- 1604 Yale Ave NW Unit 1604
- 4200 Middlebranch Ave NE
- 1022 23rd St NW
- 1417 Harrisburg Rd NE
- 1520 Frazer Ave NW
- 1532 Woodland Ave NW Unit 5
- 1532 Woodland Ave NW Unit 2
- 1411 Laiblin Place NE
- 1319 Walnut Ave NE
- 1444 Woodland Ave NW Unit 3
- 1328 Logan Ave NW Unit 1