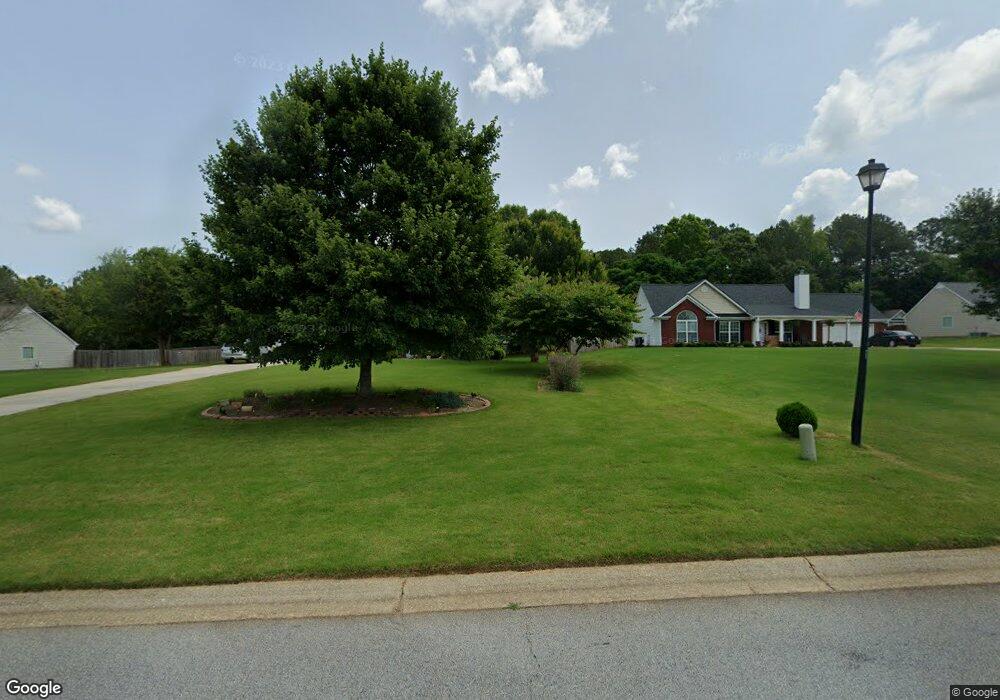
1233 Alex Dr Winder, GA 30680
Estimated Value: $341,871 - $376,000
3
Beds
2
Baths
2,174
Sq Ft
$163/Sq Ft
Est. Value
About This Home
This home is located at 1233 Alex Dr, Winder, GA 30680 and is currently estimated at $355,218, approximately $163 per square foot. 1233 Alex Dr is a home located in Barrow County with nearby schools including Statham Elementary School, Bear Creek Middle School, and Winder-Barrow High School.
Ownership History
Date
Name
Owned For
Owner Type
Purchase Details
Closed on
Feb 8, 2008
Sold by
Cit Grp Consumer Fin Inc
Bought by
Atkinson Joyce
Current Estimated Value
Home Financials for this Owner
Home Financials are based on the most recent Mortgage that was taken out on this home.
Original Mortgage
$120,000
Outstanding Balance
$74,857
Interest Rate
5.85%
Mortgage Type
New Conventional
Estimated Equity
$280,361
Purchase Details
Closed on
Aug 14, 2007
Sold by
Vang Ki
Bought by
Cit Grp Consumer Fianance Inc
Purchase Details
Closed on
Mar 30, 2004
Sold by
D & E Inv Llc
Bought by
Jim Flanigan Builders Inc
Home Financials for this Owner
Home Financials are based on the most recent Mortgage that was taken out on this home.
Original Mortgage
$120,000
Interest Rate
5.53%
Purchase Details
Closed on
Nov 10, 2003
Bought by
D & E Investments
Create a Home Valuation Report for This Property
The Home Valuation Report is an in-depth analysis detailing your home's value as well as a comparison with similar homes in the area
Home Values in the Area
Average Home Value in this Area
Purchase History
| Date | Buyer | Sale Price | Title Company |
|---|---|---|---|
| Atkinson Joyce | $120,000 | -- | |
| Cit Grp Consumer Fianance Inc | $127,705 | -- | |
| The Cit Group Consumer Fianance Inc | -- | -- | |
| Jim Flanigan Builders Inc | $38,000 | -- | |
| D & E Investments | -- | -- |
Source: Public Records
Mortgage History
| Date | Status | Borrower | Loan Amount |
|---|---|---|---|
| Open | Atkinson Joyce | $120,000 | |
| Previous Owner | Jim Flanigan Builders Inc | $120,000 |
Source: Public Records
Tax History Compared to Growth
Tax History
| Year | Tax Paid | Tax Assessment Tax Assessment Total Assessment is a certain percentage of the fair market value that is determined by local assessors to be the total taxable value of land and additions on the property. | Land | Improvement |
|---|---|---|---|---|
| 2024 | $1,228 | $100,385 | $22,000 | $78,385 |
| 2023 | $849 | $101,185 | $22,000 | $79,185 |
| 2022 | $1,128 | $90,981 | $22,000 | $68,981 |
| 2021 | $773 | $70,371 | $16,000 | $54,371 |
| 2020 | $762 | $70,371 | $16,000 | $54,371 |
| 2019 | $736 | $65,501 | $16,000 | $49,501 |
| 2018 | $532 | $50,662 | $11,200 | $39,462 |
| 2017 | $1,308 | $44,930 | $11,200 | $33,730 |
| 2016 | $451 | $45,300 | $11,200 | $34,100 |
| 2015 | $933 | $45,670 | $11,200 | $34,470 |
| 2014 | $395 | $42,288 | $7,448 | $34,840 |
| 2013 | -- | $40,593 | $7,448 | $33,145 |
Source: Public Records
Map
Nearby Homes
- 1282 Kesler Rd
- 00 Bird Hammond Rd
- 0 Giles Rd Unit 10539344
- 1200 Breckinridge Trail
- 64 Westlyn Way
- 123 Westlyn Way
- 163 Westlyn Way
- 63 Westlyn Way
- 66 Westlyn Way
- 61 Westlyn Ln
- 72 Westlyn Ln
- 71 Westlyn Ln
- 130 Bowman Mill Rd NE Unit 1
- 130 (Tract 1) Bowman Mill Rd NE
- 572 Elder Rd SE
- 568 Elder Rd SE
- 564 Elder Rd SE
- 576 Elder Rd SE
- 0 Wall Rd Unit 10504981
- 0 Wall Rd Unit 7564754