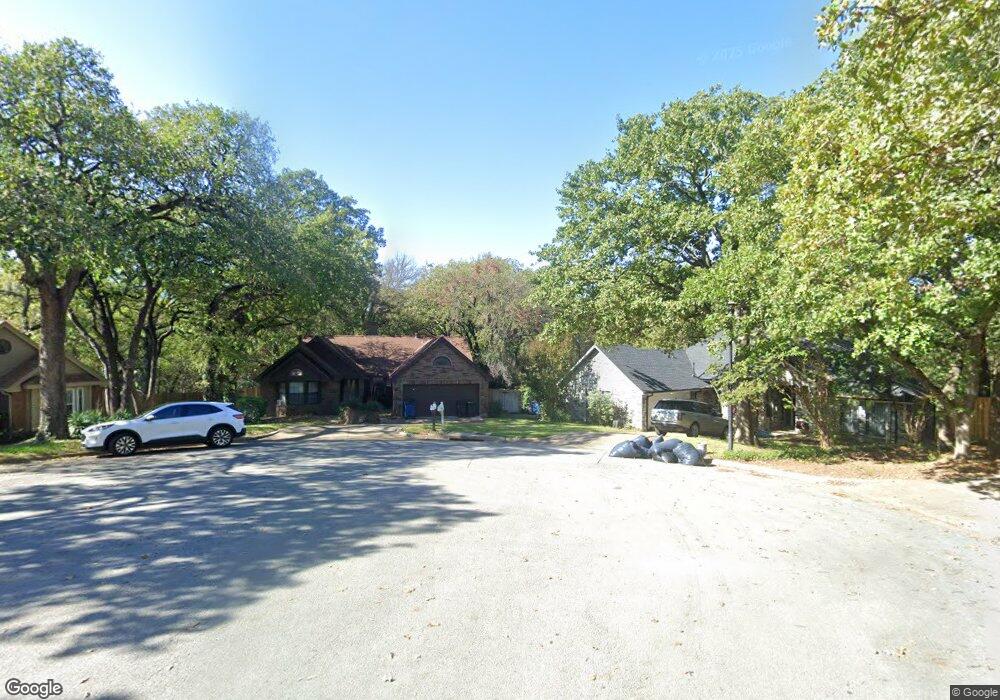
1233 Circle View Ct Grapevine, TX 76051
Estimated Value: $445,416 - $581,000
3
Beds
2
Baths
1,635
Sq Ft
$298/Sq Ft
Est. Value
About This Home
This home is located at 1233 Circle View Ct, Grapevine, TX 76051 and is currently estimated at $487,354, approximately $298 per square foot. 1233 Circle View Ct is a home located in Tarrant County with nearby schools including Silver Lake Elementary School, Grapevine Middle, and Southlake Montessori.
Ownership History
Date
Name
Owned For
Owner Type
Purchase Details
Closed on
Dec 3, 2004
Sold by
Wachtel John and Wachtel Kim
Bought by
Mcanally Andrea
Current Estimated Value
Home Financials for this Owner
Home Financials are based on the most recent Mortgage that was taken out on this home.
Original Mortgage
$158,000
Outstanding Balance
$78,863
Interest Rate
5.68%
Mortgage Type
Purchase Money Mortgage
Estimated Equity
$408,491
Purchase Details
Closed on
Mar 25, 1997
Sold by
Owens Waylan and Owens Tami Jo
Bought by
Wachtel John and Vermillion Kim
Home Financials for this Owner
Home Financials are based on the most recent Mortgage that was taken out on this home.
Original Mortgage
$105,750
Interest Rate
7.65%
Purchase Details
Closed on
Feb 24, 1995
Sold by
Prudential Relocation Management
Bought by
Owens Waylan and Nelson Tami Jo
Home Financials for this Owner
Home Financials are based on the most recent Mortgage that was taken out on this home.
Original Mortgage
$99,250
Interest Rate
9.04%
Create a Home Valuation Report for This Property
The Home Valuation Report is an in-depth analysis detailing your home's value as well as a comparison with similar homes in the area
Home Values in the Area
Average Home Value in this Area
Purchase History
| Date | Buyer | Sale Price | Title Company |
|---|---|---|---|
| Mcanally Andrea | -- | -- | |
| Wachtel John | -- | Safeco Land Title | |
| Owens Waylan | -- | Stewart Title |
Source: Public Records
Mortgage History
| Date | Status | Borrower | Loan Amount |
|---|---|---|---|
| Open | Mcanally Andrea | $158,000 | |
| Previous Owner | Wachtel John | $105,750 | |
| Previous Owner | Owens Waylan | $99,250 |
Source: Public Records
Tax History
| Year | Tax Paid | Tax Assessment Tax Assessment Total Assessment is a certain percentage of the fair market value that is determined by local assessors to be the total taxable value of land and additions on the property. | Land | Improvement |
|---|---|---|---|---|
| 2025 | $4,583 | $399,876 | -- | -- |
| 2024 | $1,479 | $401,315 | $85,000 | $316,315 |
| 2023 | $5,540 | $373,028 | $75,000 | $298,028 |
| 2022 | $5,952 | $356,984 | $50,000 | $306,984 |
| 2021 | $5,938 | $273,121 | $50,000 | $223,121 |
| 2020 | $6,047 | $274,907 | $50,000 | $224,907 |
| 2019 | $6,051 | $267,028 | $50,000 | $217,028 |
| 2018 | $1,434 | $241,237 | $50,000 | $191,237 |
| 2017 | $5,154 | $241,010 | $50,000 | $191,010 |
| 2016 | $4,686 | $224,216 | $50,000 | $174,216 |
| 2015 | $3,739 | $184,200 | $25,000 | $159,200 |
| 2014 | $3,739 | $184,200 | $25,000 | $159,200 |
Source: Public Records
Map
Nearby Homes
- 826 Lake Forest Ct
- 941 Meadowbend Loop S
- 1428 Hampton Rd
- 1313 Tillery Ct
- 6007 Laurel Ln
- 6011 Laurel Ln
- 2010 Heatherbrook Dr
- 1626 Choteau Cir
- 2081 Holt Way
- 1624 Choteau Cir
- 1323 Dublin St
- 471 Caviness Dr
- 1641 Choteau Cir
- 1656 Sonnet Dr
- 305 Bluebonnet Dr
- 2136 Pritchard Dr
- 900 Water Oak Dr
- 1804 Hunters Ridge Dr
- 309 N Main St
- 1409 Briarcrest Dr
- 1229 Circle View Ct
- 1226 Circle View Ct
- 1225 Circle View Ct
- 1222 Circle View Ct
- 732 N Dove Rd
- 1218 Circle View Ct
- 1221 Circle View Ct
- 1214 Circle View Ct
- 1217 Sandhurst Ct
- 1217 Circle View Ct
- 729 Forest St
- 600 N Dove Rd
- 606 N Dove Rd
- 1213 Sandhurst Ct
- 1222 Sandhurst Ct
- 731 Forest St
- 1401 Tiffany Forest Ln
- 1402 Tiffany Forest Ln
- 1210 Circle View Ct
- 718 N Dove Rd
Your Personal Tour Guide
Ask me questions while you tour the home.