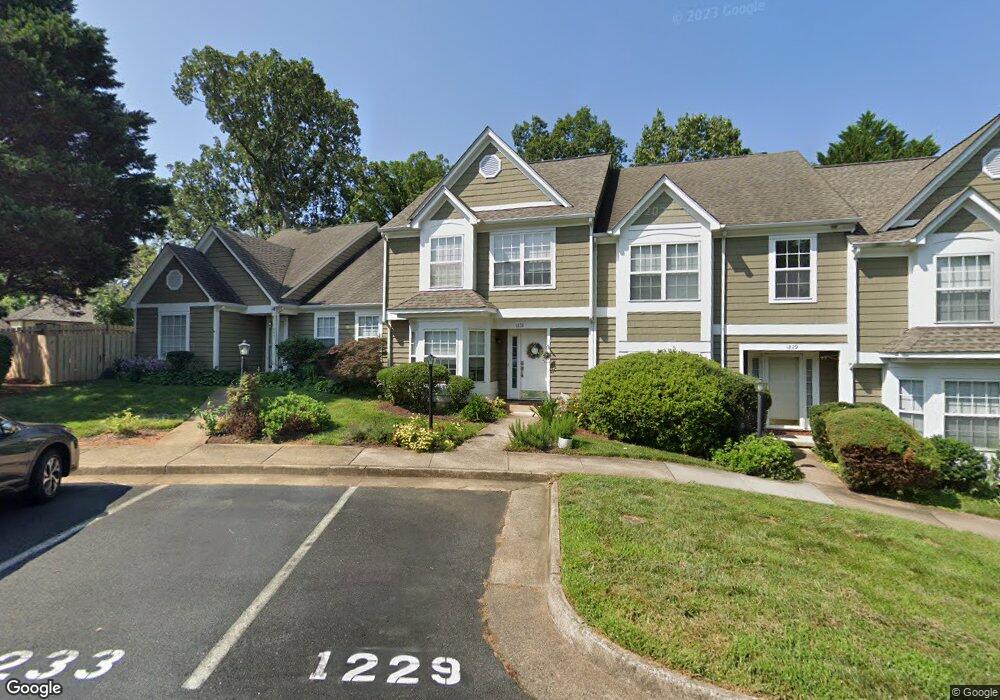
1233 Clifden Green Charlottesville, VA 22901
Riverrun NeighborhoodEstimated Value: $351,000 - $389,963
3
Beds
3
Baths
1,442
Sq Ft
$256/Sq Ft
Est. Value
About This Home
This home is located at 1233 Clifden Green, Charlottesville, VA 22901 and is currently estimated at $368,491, approximately $255 per square foot. 1233 Clifden Green is a home located in Albemarle County with nearby schools including Agnor Hurt Elementary School, Jackson P. Burley Middle School, and Albemarle High School.
Ownership History
Date
Name
Owned For
Owner Type
Purchase Details
Closed on
Dec 20, 2021
Sold by
Johnson Alicia
Bought by
Garcia Camille and Bukic Dino
Current Estimated Value
Home Financials for this Owner
Home Financials are based on the most recent Mortgage that was taken out on this home.
Original Mortgage
$288,000
Outstanding Balance
$266,985
Interest Rate
3.09%
Mortgage Type
New Conventional
Estimated Equity
$101,506
Purchase Details
Closed on
Aug 4, 2021
Sold by
Johnson Cooper and Johnson Alicia
Bought by
Johnson Alicia
Purchase Details
Closed on
Dec 20, 2020
Sold by
Renshaw Andrew N and Tablan Nathalie C
Bought by
Johnson Cooper and Johnson Alicia
Create a Home Valuation Report for This Property
The Home Valuation Report is an in-depth analysis detailing your home's value as well as a comparison with similar homes in the area
Home Values in the Area
Average Home Value in this Area
Purchase History
| Date | Buyer | Sale Price | Title Company |
|---|---|---|---|
| Garcia Camille | $320,000 | Chicago Title Insurance Co | |
| Johnson Alicia | -- | None Available | |
| Johnson Cooper | $268,500 | Stewart Title Guaranty Co |
Source: Public Records
Mortgage History
| Date | Status | Borrower | Loan Amount |
|---|---|---|---|
| Open | Garcia Camille | $288,000 | |
| Previous Owner | Tablan Nathalie C | $172,500 | |
| Previous Owner | Tablan Nathalie C | $183,960 | |
| Previous Owner | Tablan Nathalie C | $34,492 |
Source: Public Records
Tax History Compared to Growth
Tax History
| Year | Tax Paid | Tax Assessment Tax Assessment Total Assessment is a certain percentage of the fair market value that is determined by local assessors to be the total taxable value of land and additions on the property. | Land | Improvement |
|---|---|---|---|---|
| 2025 | -- | $350,100 | $80,000 | $270,100 |
| 2024 | -- | $340,000 | $75,000 | $265,000 |
| 2023 | $2,867 | $335,700 | $72,500 | $263,200 |
| 2022 | $2,571 | $301,000 | $72,500 | $228,500 |
| 2021 | $2,174 | $254,600 | $62,500 | $192,100 |
| 2020 | $2,101 | $246,000 | $60,000 | $186,000 |
| 2019 | $1,976 | $231,400 | $60,000 | $171,400 |
| 2018 | $1,843 | $225,700 | $60,000 | $165,700 |
| 2017 | $1,793 | $213,700 | $55,000 | $158,700 |
| 2016 | $1,714 | $204,300 | $55,000 | $149,300 |
| 2015 | $820 | $200,300 | $55,000 | $145,300 |
| 2014 | -- | $198,600 | $55,000 | $143,600 |
Source: Public Records
Map
Nearby Homes
- 1245 Clifden Green
- 1273 Clifden Green
- 1218 Clifden Green
- 1214 Clifden Green
- 1236 Clifden Green
- 1248 Clifden Green
- 732 Exton Ct
- 1348 Le Parc Terrace
- 2014 Bethpage Ct
- 1371 Le Parc Terrace
- 1375 Le Parc Terrace
- 1614 Sawgrass Ct
- 1619 Sawgrass Ct
- 39 Lindley Ln
- 5024 Lindley Ln
- 5020 Lindley Ln
- 35 Lindley Ln
- 1229 Clifden Green
- 1237 Clifden Green
- 1225 Clifden Green
- 1221 Clifden Green
- 1217 Clifden Green
- 1249 Clifden Green
- 1259 Chatham Ridge
- 1284 Chatham Ridge
- 1257 Chatham Ridge
- 1255 Chatham Ridge
- 1257 Clifden Green
- 774 Merion Greene
- 776 Merion Greene
- 772 Merion Greene
- 778 Merion Greene
- 780 Merion Greene
- 1253 Chatham Ridge
- 1280 Chatham Ridge
- 782 Merion Greene
- 1224 Clifden Green