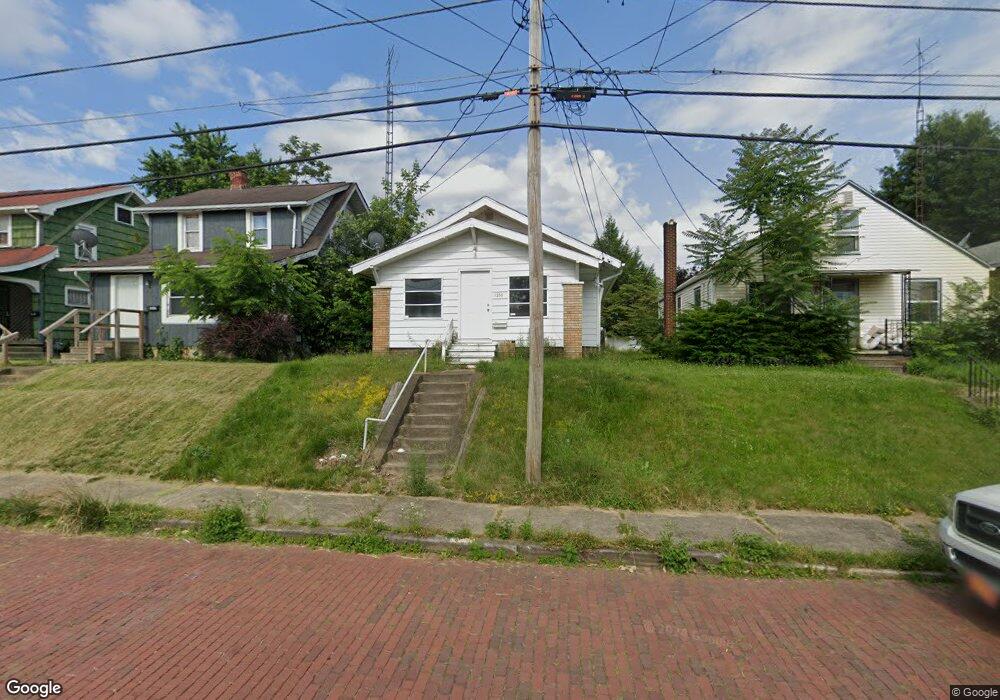
1233 Concord Ave SW Canton, OH 44710
Souers NeighborhoodEstimated Value: $89,000 - $137,000
2
Beds
1
Bath
982
Sq Ft
$108/Sq Ft
Est. Value
About This Home
This home is located at 1233 Concord Ave SW, Canton, OH 44710 and is currently estimated at $106,372, approximately $108 per square foot. 1233 Concord Ave SW is a home located in Stark County with nearby schools including Early Learning Center @ Schreiber, Cedar Elementary School, and McGregor Elementary School.
Ownership History
Date
Name
Owned For
Owner Type
Purchase Details
Closed on
Sep 27, 2016
Sold by
Euity Trust Co
Bought by
Bsmk Llc
Current Estimated Value
Purchase Details
Closed on
Oct 29, 2009
Sold by
Bank Of New York
Bought by
Equity Trust Company and 58598 Ira
Purchase Details
Closed on
Aug 11, 2009
Sold by
Calloway Randall S
Bought by
The Bank Of New York
Purchase Details
Closed on
Jun 12, 2006
Sold by
Grissom Bonnie J and Grissom Joel
Bought by
Calloway Randall S
Home Financials for this Owner
Home Financials are based on the most recent Mortgage that was taken out on this home.
Original Mortgage
$60,000
Interest Rate
8.39%
Mortgage Type
Fannie Mae Freddie Mac
Purchase Details
Closed on
Jun 29, 1998
Sold by
Kasserman Phyllis J
Bought by
Grissom Bonnie J
Purchase Details
Closed on
Mar 5, 1998
Sold by
Lombardi Nicholas J
Bought by
Kasserman Phyllis J and Grissom Bonnie J
Create a Home Valuation Report for This Property
The Home Valuation Report is an in-depth analysis detailing your home's value as well as a comparison with similar homes in the area
Home Values in the Area
Average Home Value in this Area
Purchase History
| Date | Buyer | Sale Price | Title Company |
|---|---|---|---|
| Bsmk Llc | $27,000 | None Available | |
| Equity Trust Company | $14,500 | Lawyers Title Akron | |
| The Bank Of New York | $46,000 | None Available | |
| Calloway Randall S | $75,000 | None Available | |
| Grissom Bonnie J | -- | -- | |
| Kasserman Phyllis J | $47,500 | -- |
Source: Public Records
Mortgage History
| Date | Status | Borrower | Loan Amount |
|---|---|---|---|
| Previous Owner | Calloway Randall S | $60,000 |
Source: Public Records
Tax History
| Year | Tax Paid | Tax Assessment Tax Assessment Total Assessment is a certain percentage of the fair market value that is determined by local assessors to be the total taxable value of land and additions on the property. | Land | Improvement |
|---|---|---|---|---|
| 2025 | -- | $9,490 | $4,760 | $4,730 |
| 2024 | -- | $9,490 | $4,760 | $4,730 |
| 2023 | $969 | $10,960 | $4,340 | $6,620 |
| 2022 | $654 | $10,960 | $4,340 | $6,620 |
| 2021 | $661 | $10,960 | $4,340 | $6,620 |
| 2020 | $602 | $8,930 | $3,610 | $5,320 |
| 2019 | $522 | $8,930 | $3,610 | $5,320 |
Source: Public Records
Map
Nearby Homes
- 1138 Roslyn Ave SW
- 1372 Maryland Ave SW
- 1248 Dartmouth Ave SW
- 1379 Maryland Ave SW
- 3211 11th St SW
- 1252 Dartmouth Ave SW
- 2715 Blair Place SW
- 929 Wertz Ave SW
- 1014 Roslyn Ave SW
- 2711 Blair Place SW
- 1207 Linwood Ave SW
- 1030 Dartmouth Ave SW
- 942 Bellflower Ave SW
- 3204 14th St SW
- 1241 Bedford Ave SW
- 1002 Dartmouth Ave SW
- 1425 Crescent Rd SW
- 900 Roslyn Ave SW
- 2423 12th St SW
- 1114 Bedford Ave SW
- 1229 Concord Ave SW
- 1237 Concord Ave SW
- 1241 Concord Ave SW
- 1245 Concord Ave SW
- 1223 Concord Ave SW
- 1219 Concord Ave SW
- 1247 Concord Ave SW
- 1232 Maryland Ave SW
- 1236 Maryland Ave SW
- 1230 Maryland Ave SW
- 1240 Maryland Ave SW
- 1251 Concord Ave SW
- 1222 Maryland Ave SW
- 1232 Concord Ave SW
- 1236 Concord Ave SW
- 1228 Concord Ave SW
- 1226 Concord Ave SW
- 1240 Concord Ave SW
- 1248 Maryland Ave SW
- 1213 Concord Ave SW
Your Personal Tour Guide
Ask me questions while you tour the home.