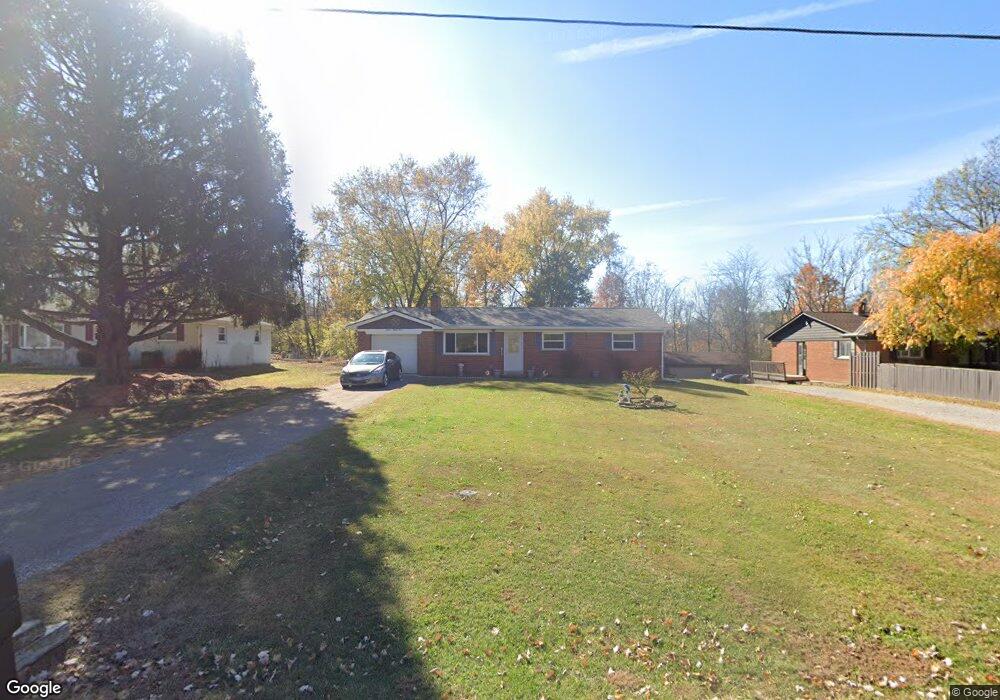
1233 Duncan Dr Milford, OH 45150
Estimated Value: $171,000 - $220,000
3
Beds
1
Bath
1,144
Sq Ft
$175/Sq Ft
Est. Value
About This Home
This home is located at 1233 Duncan Dr, Milford, OH 45150 and is currently estimated at $200,050, approximately $174 per square foot. 1233 Duncan Dr is a home located in Clermont County with nearby schools including Willowville Elementary School, West Clermont Middle School, and West Clermont High School.
Ownership History
Date
Name
Owned For
Owner Type
Purchase Details
Closed on
Feb 26, 2020
Sold by
Jacob James Vincent
Bought by
Russell Ethel and Ruehl Nancy C
Current Estimated Value
Home Financials for this Owner
Home Financials are based on the most recent Mortgage that was taken out on this home.
Original Mortgage
$68,000
Outstanding Balance
$60,109
Interest Rate
3.4%
Mortgage Type
New Conventional
Estimated Equity
$139,941
Purchase Details
Closed on
Feb 7, 2019
Sold by
Dawson Paula K and Dawson Kevin
Bought by
Jacob James Vincent
Purchase Details
Closed on
Jan 28, 2019
Sold by
Frazier Carol J
Bought by
Jacob James Vincent
Purchase Details
Closed on
Dec 8, 2018
Sold by
Tartar Linda and Tartar Raymond J
Bought by
Jacob James Vincent
Purchase Details
Closed on
Nov 14, 2018
Sold by
Estate Of Emma Jacob
Bought by
Jacob James Vincent and Scott Sharon L
Create a Home Valuation Report for This Property
The Home Valuation Report is an in-depth analysis detailing your home's value as well as a comparison with similar homes in the area
Home Values in the Area
Average Home Value in this Area
Purchase History
| Date | Buyer | Sale Price | Title Company |
|---|---|---|---|
| Russell Ethel | $80,000 | Mattingly Ford Ttl Svcs Llc | |
| Jacob James Vincent | -- | None Available | |
| Jacob James Vincent | -- | None Available | |
| Jacob James Vincent | -- | None Available | |
| Jacob James Vincent | -- | None Available |
Source: Public Records
Mortgage History
| Date | Status | Borrower | Loan Amount |
|---|---|---|---|
| Open | Russell Ethel | $68,000 |
Source: Public Records
Tax History Compared to Growth
Tax History
| Year | Tax Paid | Tax Assessment Tax Assessment Total Assessment is a certain percentage of the fair market value that is determined by local assessors to be the total taxable value of land and additions on the property. | Land | Improvement |
|---|---|---|---|---|
| 2024 | $2,309 | $45,780 | $13,790 | $31,990 |
| 2023 | $2,312 | $45,780 | $13,790 | $31,990 |
| 2022 | $1,897 | $32,550 | $9,800 | $22,750 |
| 2021 | $1,905 | $32,550 | $9,800 | $22,750 |
| 2020 | $1,394 | $32,550 | $9,800 | $22,750 |
| 2019 | $1,163 | $31,960 | $9,800 | $22,160 |
| 2018 | $1,662 | $31,960 | $9,800 | $22,160 |
| 2017 | $1,147 | $31,960 | $9,800 | $22,160 |
| 2016 | $1,295 | $31,960 | $9,800 | $22,160 |
| 2015 | $1,242 | $31,960 | $9,800 | $22,160 |
| 2014 | $1,242 | $31,960 | $9,800 | $22,160 |
| 2013 | $1,268 | $32,100 | $9,100 | $23,000 |
Source: Public Records
Map
Nearby Homes
- 4820 Teal Ln
- 1202 Lismore Dr
- 1165 Village Glen Dr
- 4820 Tomahawk Trail
- 1260 Timber Ridge Ct
- 4597 Muirridge Ct
- 4579 Wood Forest Ln
- 4601 Shephard Rd
- 4713 Shephard Rd
- 4571 Carnoustie
- 994 Shephard Woods Ct
- 4503 Eva Ln
- 1278 McGuffey Ln
- 4536 Tealtown Rd
- 4466 Eva Ln
- 4536 Treeview Ct
- 4455 Dogwood Dr
- 4449 Glendale Dr
- 4442 Meese Dr
- 1311 U S 50
- 1235 Duncan Dr
- 1231 Duncan Dr
- 1239 Duncan Dr
- 1241 Duncan Dr
- 1232 Duncan Dr
- 1236 Duncan Dr
- 1243 Duncan Dr
- 1240 Duncan Dr
- 1242 Duncan Dr
- 1247 Duncan Dr
- 1244 Duncan Dr
- 1249 Duncan Dr
- 4352 Duncan Dr
- 1248 Duncan Dr
- 1251 Duncan Dr
- 1250 Duncan Dr
- 1252 Duncan Dr
- 4753 Tealtown Rd
- 4747 Tealtown Rd
- 4745 Tealtown Rd