1233 Main St San Luis, AZ 85349
--
Bed
--
Bath
1,606
Sq Ft
0.74
Acres
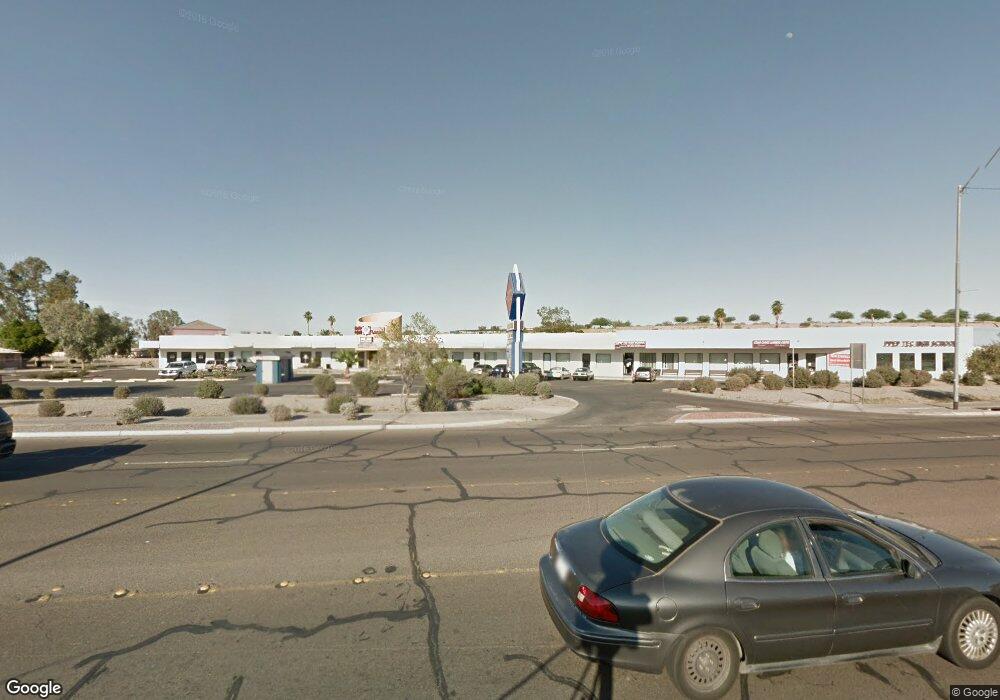
About This Home
This home is located at 1233 Main St, San Luis, AZ 85349. 1233 Main St is a home located in Yuma County with nearby schools including Arizona Desert Elementary School, San Luis Middle School, and San Luis High School.
Ownership History
Date
Name
Owned For
Owner Type
Purchase Details
Closed on
Dec 27, 2019
Sold by
Gi Holdings Llc
Bought by
Columbia City Associates Llc
Home Financials for this Owner
Home Financials are based on the most recent Mortgage that was taken out on this home.
Original Mortgage
$1,515,000
Outstanding Balance
$1,341,138
Interest Rate
3.7%
Mortgage Type
Commercial
Purchase Details
Closed on
Mar 20, 2012
Sold by
Spaulding Robert F and Spaulding Carol V
Bought by
Jackson Square Llc
Home Financials for this Owner
Home Financials are based on the most recent Mortgage that was taken out on this home.
Original Mortgage
$950,000
Interest Rate
3.84%
Mortgage Type
Commercial
Purchase Details
Closed on
Feb 5, 2009
Sold by
Pen Holdings Llc
Bought by
Spaulding Robert F and Spaulding Carol
Purchase Details
Closed on
Mar 10, 2003
Sold by
Azmm Llc
Bought by
Pen Holdings Llc
Home Financials for this Owner
Home Financials are based on the most recent Mortgage that was taken out on this home.
Original Mortgage
$445,000
Interest Rate
5.73%
Create a Home Valuation Report for This Property
The Home Valuation Report is an in-depth analysis detailing your home's value as well as a comparison with similar homes in the area
Home Values in the Area
Average Home Value in this Area
Purchase History
| Date | Buyer | Sale Price | Title Company |
|---|---|---|---|
| Columbia City Associates Llc | $2,100,000 | Empire West Title Agency Llc | |
| Jackson Square Llc | -- | Title Security | |
| Spaulding Robert F | -- | Citizens Title | |
| Pen Holdings Llc | -- | Citizens Title |
Source: Public Records
Mortgage History
| Date | Status | Borrower | Loan Amount |
|---|---|---|---|
| Open | Columbia City Associates Llc | $1,515,000 | |
| Previous Owner | Jackson Square Llc | $950,000 | |
| Previous Owner | Pen Holdings Llc | $445,000 |
Source: Public Records
Tax History Compared to Growth
Tax History
| Year | Tax Paid | Tax Assessment Tax Assessment Total Assessment is a certain percentage of the fair market value that is determined by local assessors to be the total taxable value of land and additions on the property. | Land | Improvement |
|---|---|---|---|---|
| 2025 | $21,026 | $198,040 | $26,922 | $171,118 |
| 2024 | $21,320 | $194,503 | $6,299 | $188,204 |
| 2023 | $21,320 | $190,854 | $6,779 | $184,075 |
| 2022 | $21,889 | $187,112 | $1,779 | $185,333 |
| 2021 | $24,691 | $183,293 | $2,145 | $181,148 |
| 2020 | $22,562 | $174,565 | $2,168 | $172,397 |
| 2019 | $22,451 | $166,253 | $2,261 | $163,992 |
| 2018 | $21,818 | $158,336 | $2,340 | $155,996 |
| 2017 | $21,074 | $158,336 | $2,340 | $155,996 |
| 2016 | $22,472 | $152,723 | $2,340 | $150,383 |
| 2015 | $20,815 | $4,030 | $55 | $3,975 |
| 2014 | $20,815 | $189,068 | $2,373 | $186,695 |
Source: Public Records
Map
Nearby Homes
- 1477 N Bentu Ave
- 1487 Cadena Ave
- 219 E Rio Sonora St
- 239 Zapata St
- 606 N 4th Ave
- 191 E Zapata St
- 201 E Patricia St
- 1675 Union St
- 1643 Union St
- 1636 Union St
- 1651 Union St
- 1683 Union St
- 995 E B St
- 1384 E San Pedro St
- 1470 N Quintero Ave
- 1432 N Montes Ave
- 2078 E Mendez St
- 0 Vac Vic Avenue H8 25th Stw
- 2225 N Garcia Blvd
- 2559 Edais St
- 1304 N Arden Ave
- 567 E Estrella Dr
- 568 E Manzanita Dr
- 1312 Arden Ave
- 570 E Estrella Dr
- 576 E Manzanita Dr
- 565 E Manzanita Dr
- 574 Estrella Dr
- 1320 Arden Ave
- 575 E Estrella Dr
- 571 E Dominguez Dr
- 1262 Hidalgo Ave Unit 1262 N. Hidalgo Ave
- 1262 Hidalgo Ave
- 579 E Dominguez Dr
- 1211 E Lakin Dr
- 584 E Manzanita Dr
- 571 E Manzanita Dr
- 1328 N Arden Ave
- 586 E Estrella Dr
- 1205 E Lakin Dr