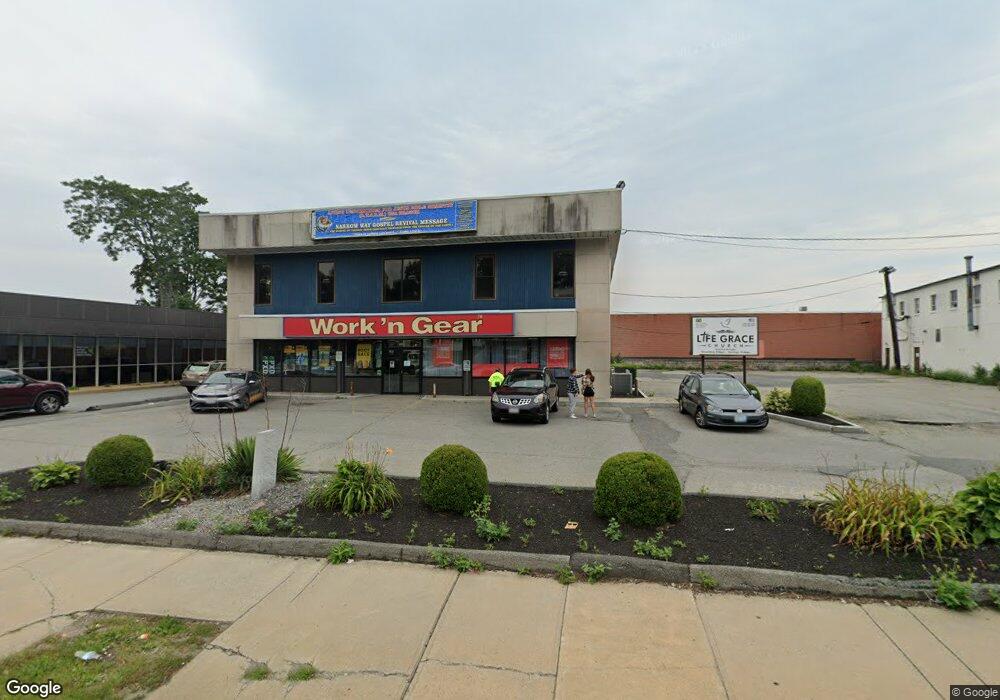
1233 Main St Worcester, MA 01603
Webster Square NeighborhoodEstimated Value: $1,073,820
Studio
--
Bath
10,200
Sq Ft
$105/Sq Ft
Est. Value
About This Home
This home is located at 1233 Main St, Worcester, MA 01603 and is currently estimated at $1,073,820, approximately $105 per square foot. 1233 Main St is a home located in Worcester County with nearby schools including Gates Lane, Jacob Hiatt Magnet School, and Chandler Magnet.
Ownership History
Date
Name
Owned For
Owner Type
Purchase Details
Closed on
Mar 16, 2007
Sold by
Kermanian Haiim
Bought by
Sharona Inc
Current Estimated Value
Purchase Details
Closed on
May 2, 2003
Sold by
Jems Of Ne Inc and Marane Oil Corp
Bought by
Kermanian Haiim
Home Financials for this Owner
Home Financials are based on the most recent Mortgage that was taken out on this home.
Original Mortgage
$375,000
Interest Rate
5.82%
Mortgage Type
Commercial
Create a Home Valuation Report for This Property
The Home Valuation Report is an in-depth analysis detailing your home's value as well as a comparison with similar homes in the area
Home Values in the Area
Average Home Value in this Area
Purchase History
| Date | Buyer | Sale Price | Title Company |
|---|---|---|---|
| Sharona Inc | -- | -- | |
| Kermanian Haiim | $500,000 | -- |
Source: Public Records
Mortgage History
| Date | Status | Borrower | Loan Amount |
|---|---|---|---|
| Previous Owner | Kermanian Haiim | $375,000 |
Source: Public Records
Tax History
| Year | Tax Paid | Tax Assessment Tax Assessment Total Assessment is a certain percentage of the fair market value that is determined by local assessors to be the total taxable value of land and additions on the property. | Land | Improvement |
|---|---|---|---|---|
| 2025 | $27,715 | $968,700 | $348,400 | $620,300 |
| 2024 | $26,775 | $891,300 | $348,400 | $542,900 |
| 2023 | $26,293 | $841,100 | $303,100 | $538,000 |
| 2022 | $26,254 | $787,700 | $303,100 | $484,600 |
| 2021 | $28,833 | $796,500 | $234,800 | $561,700 |
| 2020 | $28,005 | $796,500 | $234,800 | $561,700 |
| 2019 | $27,407 | $785,300 | $234,800 | $550,500 |
| 2018 | $26,635 | $782,700 | $234,800 | $547,900 |
| 2017 | $25,774 | $782,700 | $234,800 | $547,900 |
| 2016 | $24,860 | $731,600 | $228,000 | $503,600 |
| 2015 | $23,214 | $731,600 | $228,000 | $503,600 |
| 2014 | $22,555 | $731,600 | $228,000 | $503,600 |
Source: Public Records
Map
Nearby Homes
- 27 Montague St
- 37 Gates Rd
- 103 Henshaw St
- 89 Mill St
- 84 Eureka St
- 55 Grandview Ave
- 10 Hulbert Rd Unit 10
- 215 Mill St Unit 113
- 215 Mill St Unit 115
- 32 Goddard Memorial Dr
- 56 Goddard Memorial Dr
- 1038 Main St
- 60 Circuit Ave S
- 18 Haynes St
- 10 Lucian St
- 1022 Main St
- 5 Stoneland Rd
- 12 Stoneland Rd
- 13 Merchant St
- 152 Beaverbrook Pkwy
Your Personal Tour Guide
Ask me questions while you tour the home.