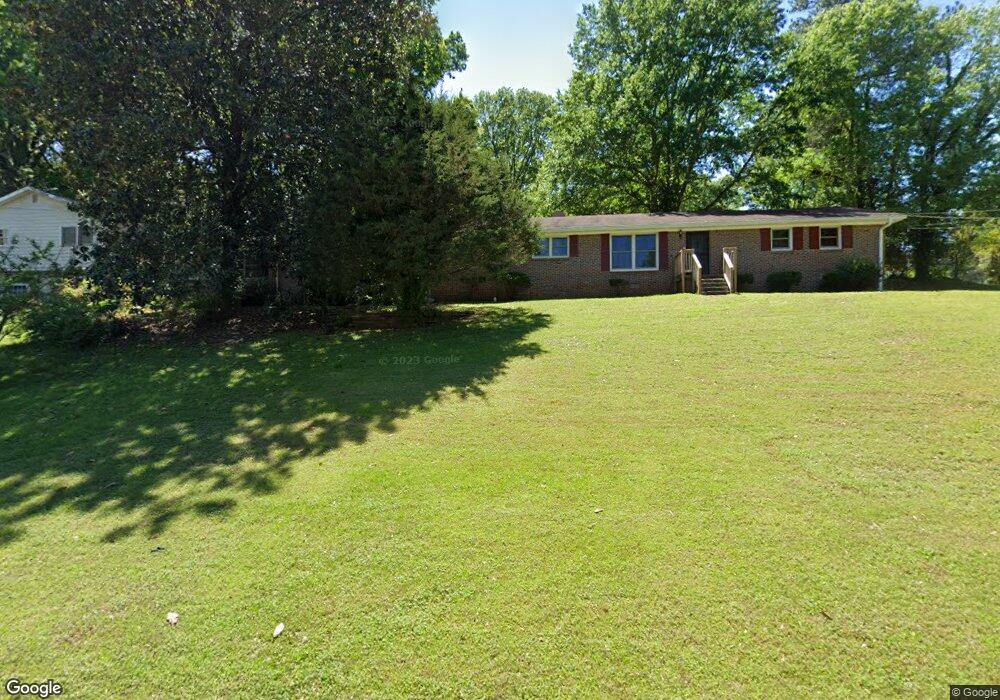
1233 Mohican Trail Stone Mountain, GA 30083
Estimated Value: $235,996 - $267,000
3
Beds
2
Baths
1,283
Sq Ft
$194/Sq Ft
Est. Value
About This Home
This home is located at 1233 Mohican Trail, Stone Mountain, GA 30083 and is currently estimated at $249,499, approximately $194 per square foot. 1233 Mohican Trail is a home located in DeKalb County with nearby schools including Rowland Elementary School, Mary McLeod Bethune Middle School, and Towers High School.
Ownership History
Date
Name
Owned For
Owner Type
Purchase Details
Closed on
Feb 28, 2022
Sold by
Newell Glenford Neil
Bought by
Newell Glenford Neil and Newell Dionne Patricia
Current Estimated Value
Purchase Details
Closed on
Oct 8, 2021
Sold by
Johnson James
Bought by
Newell Glenford Neil
Home Financials for this Owner
Home Financials are based on the most recent Mortgage that was taken out on this home.
Original Mortgage
$201,286
Interest Rate
2.8%
Mortgage Type
FHA
Purchase Details
Closed on
Dec 1, 2020
Sold by
Johnson Mary Lee Estate
Bought by
Johnson James
Purchase Details
Closed on
Oct 12, 1994
Sold by
Benoit Fred R Risa M
Bought by
Johnson James Mary L
Home Financials for this Owner
Home Financials are based on the most recent Mortgage that was taken out on this home.
Original Mortgage
$76,250
Interest Rate
8.46%
Mortgage Type
FHA
Create a Home Valuation Report for This Property
The Home Valuation Report is an in-depth analysis detailing your home's value as well as a comparison with similar homes in the area
Home Values in the Area
Average Home Value in this Area
Purchase History
| Date | Buyer | Sale Price | Title Company |
|---|---|---|---|
| Newell Glenford Neil | -- | -- | |
| Newell Glenford Neil | $205,000 | -- | |
| Johnson James | -- | -- | |
| Johnson James Mary L | $78,000 | -- |
Source: Public Records
Mortgage History
| Date | Status | Borrower | Loan Amount |
|---|---|---|---|
| Previous Owner | Newell Glenford Neil | $201,286 | |
| Previous Owner | Johnson James Mary L | $76,250 |
Source: Public Records
Tax History Compared to Growth
Tax History
| Year | Tax Paid | Tax Assessment Tax Assessment Total Assessment is a certain percentage of the fair market value that is determined by local assessors to be the total taxable value of land and additions on the property. | Land | Improvement |
|---|---|---|---|---|
| 2024 | $4,259 | $86,800 | $10,000 | $76,800 |
| 2023 | $4,259 | $82,880 | $10,000 | $72,880 |
| 2022 | $3,689 | $75,920 | $10,000 | $65,920 |
| 2021 | $1,732 | $51,480 | $4,920 | $46,560 |
| 2020 | $1,572 | $46,680 | $4,920 | $41,760 |
| 2019 | $1,510 | $45,320 | $4,920 | $40,400 |
| 2018 | $957 | $35,920 | $4,920 | $31,000 |
| 2017 | $1,045 | $30,840 | $4,920 | $25,920 |
| 2016 | $846 | $25,720 | $4,920 | $20,800 |
| 2014 | $780 | $19,720 | $4,920 | $14,800 |
Source: Public Records
Map
Nearby Homes
- 1346 S Indian Creek Dr
- 4255 Autumn Woods Ct Unit 2
- 4197 Carrollwood Dr
- 4081 Creek Ct
- 1195 Indian Creek Place
- 4369 Carrollwood Dr
- 1203 Nancy Lee Way
- 1239 Sharonton Dr
- 1380 Colony Hill Ct
- 4058 Chedworth Way
- 1019 Privy Ln Unit 74
- 1387 Renee Dr
- 4011 Redan Rd Unit 8
- 4011 Redan Rd Unit 7
- 4011 Redan Rd Unit 6
- 3975 Phylis Place
- 4103 Indian Creek Cir
- 1410 Bronze Leaf Ct Unit IV
- 1241 Mohican Trail Unit 3
- 4149 Sioux Way
- 1219 Mohican Trail
- 1247 Mohican Trail
- 1236 Mohican Trail
- 1236 Nohican Trail
- 4142 Sioux Way Unit 3
- 1228 Mohican Trail
- 4141 Sioux Way
- 1220 Mohican Trail
- 1211 Mohican Trail
- 1244 Mohican Trail
- 1244 Mohican Trail
- 4135 Sioux Way
- 4132 Sioux Way
- 1255 Mohican Trail
- 1250 Mohican Trail Unit 3
- 1256 Mohican Trail Unit 3
- 1214 Mohican Trail Unit 3
- 4129 Sioux Way Unit 3