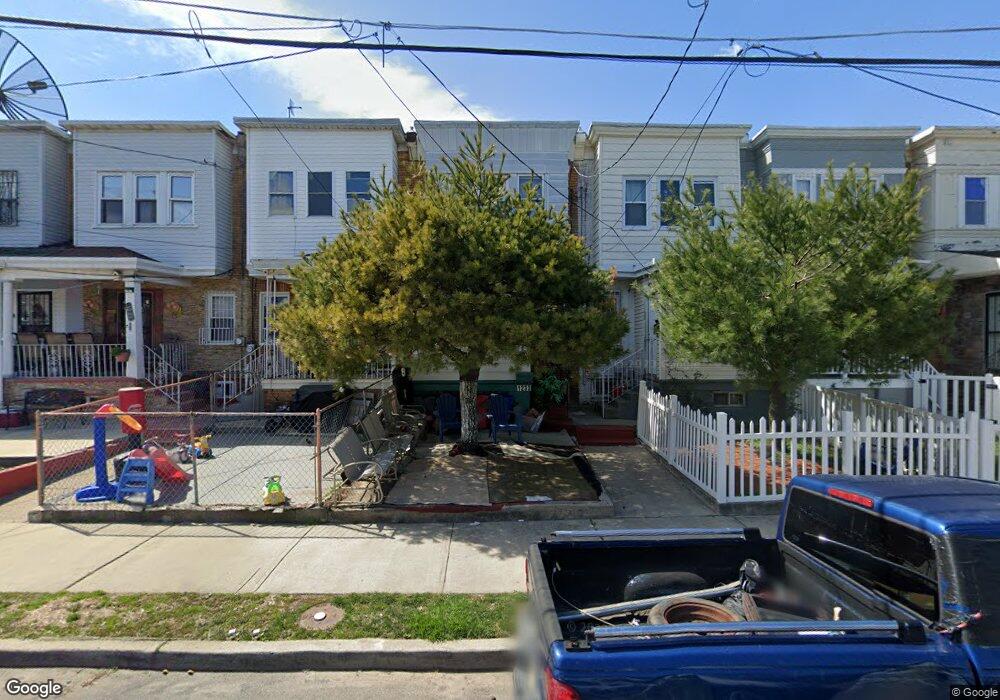
1233 N 21st St Camden, NJ 08105
Cramer Hill NeighborhoodEstimated Value: $108,778 - $193,000
--
Bed
--
Bath
1,040
Sq Ft
$132/Sq Ft
Est. Value
About This Home
This home is located at 1233 N 21st St, Camden, NJ 08105 and is currently estimated at $137,445, approximately $132 per square foot. 1233 N 21st St is a home located in Camden County with nearby schools including Veterans Memorial Middle School, Eastside High School, and Camdens Promise Charter School.
Ownership History
Date
Name
Owned For
Owner Type
Purchase Details
Closed on
Dec 27, 2011
Sold by
Salazar Alfredo
Bought by
Valdez Juan and Caba Elsa
Current Estimated Value
Home Financials for this Owner
Home Financials are based on the most recent Mortgage that was taken out on this home.
Original Mortgage
$77,972
Outstanding Balance
$53,481
Interest Rate
3.99%
Mortgage Type
FHA
Estimated Equity
$83,964
Purchase Details
Closed on
Apr 1, 2011
Sold by
Espinal Roman
Bought by
Salazar Alfredo
Purchase Details
Closed on
Apr 15, 1996
Sold by
Vicente Praxades
Bought by
Jimenez Juan
Create a Home Valuation Report for This Property
The Home Valuation Report is an in-depth analysis detailing your home's value as well as a comparison with similar homes in the area
Home Values in the Area
Average Home Value in this Area
Purchase History
| Date | Buyer | Sale Price | Title Company |
|---|---|---|---|
| Valdez Juan | $80,000 | -- | |
| Salazar Alfredo | -- | -- | |
| Jimenez Juan | $24,000 | -- |
Source: Public Records
Mortgage History
| Date | Status | Borrower | Loan Amount |
|---|---|---|---|
| Open | Valdez Juan | $77,972 |
Source: Public Records
Tax History Compared to Growth
Tax History
| Year | Tax Paid | Tax Assessment Tax Assessment Total Assessment is a certain percentage of the fair market value that is determined by local assessors to be the total taxable value of land and additions on the property. | Land | Improvement |
|---|---|---|---|---|
| 2025 | $2,073 | $58,500 | $16,800 | $41,700 |
| 2024 | $2,004 | $58,500 | $16,800 | $41,700 |
| 2023 | $2,004 | $58,500 | $16,800 | $41,700 |
| 2022 | $1,966 | $58,500 | $16,800 | $41,700 |
| 2021 | $1,959 | $58,500 | $16,800 | $41,700 |
| 2020 | $1,860 | $58,500 | $16,800 | $41,700 |
| 2019 | $1,781 | $58,500 | $16,800 | $41,700 |
| 2018 | $1,772 | $58,500 | $16,800 | $41,700 |
| 2017 | $1,729 | $58,500 | $16,800 | $41,700 |
| 2016 | $1,674 | $58,500 | $16,800 | $41,700 |
| 2015 | $1,611 | $58,500 | $16,800 | $41,700 |
| 2014 | $1,572 | $58,500 | $16,800 | $41,700 |
Source: Public Records
Map
Nearby Homes