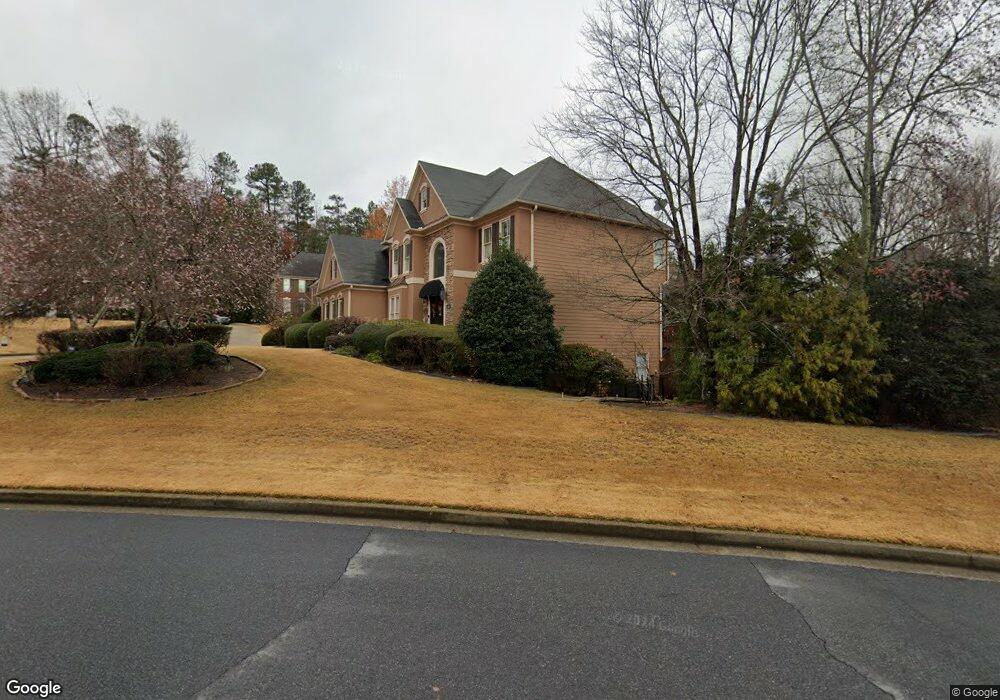
12330 Broadleaf Ln Alpharetta, GA 30005
Estimated Value: $863,000 - $1,041,000
4
Beds
4
Baths
3,925
Sq Ft
$239/Sq Ft
Est. Value
About This Home
This home is located at 12330 Broadleaf Ln, Alpharetta, GA 30005 and is currently estimated at $938,788, approximately $239 per square foot. 12330 Broadleaf Ln is a home located in Fulton County with nearby schools including Abbotts Hill Elementary School, Taylor Road Middle School, and Chattahoochee High School.
Ownership History
Date
Name
Owned For
Owner Type
Purchase Details
Closed on
May 7, 2009
Sold by
Satya Deepak K and Satya Ramya D
Bought by
Satya Deepak K and Satya Ramya D
Current Estimated Value
Home Financials for this Owner
Home Financials are based on the most recent Mortgage that was taken out on this home.
Original Mortgage
$348,750
Outstanding Balance
$220,822
Interest Rate
4.89%
Mortgage Type
New Conventional
Estimated Equity
$717,966
Purchase Details
Closed on
Jun 2, 2006
Sold by
Higginbotham Michael C and Higginbotham Meloney L
Bought by
Sathyanarayanan Deepak and Raj Ramya
Home Financials for this Owner
Home Financials are based on the most recent Mortgage that was taken out on this home.
Original Mortgage
$358,400
Interest Rate
6.5%
Mortgage Type
New Conventional
Purchase Details
Closed on
Jul 12, 1996
Sold by
Ashton Atlantares Llc
Bought by
Higginbotham Mike C Meloney L
Create a Home Valuation Report for This Property
The Home Valuation Report is an in-depth analysis detailing your home's value as well as a comparison with similar homes in the area
Home Values in the Area
Average Home Value in this Area
Purchase History
| Date | Buyer | Sale Price | Title Company |
|---|---|---|---|
| Satya Deepak K | -- | -- | |
| Sathyanarayanan Deepak | $448,000 | -- | |
| Higginbotham Mike C Meloney L | $280,500 | -- |
Source: Public Records
Mortgage History
| Date | Status | Borrower | Loan Amount |
|---|---|---|---|
| Open | Satya Deepak K | $348,750 | |
| Previous Owner | Sathyanarayanan Deepak | $358,400 | |
| Closed | Higginbotham Mike C Meloney L | $0 |
Source: Public Records
Tax History Compared to Growth
Tax History
| Year | Tax Paid | Tax Assessment Tax Assessment Total Assessment is a certain percentage of the fair market value that is determined by local assessors to be the total taxable value of land and additions on the property. | Land | Improvement |
|---|---|---|---|---|
| 2025 | $5,441 | $341,280 | $99,280 | $242,000 |
| 2023 | $5,441 | $330,080 | $78,840 | $251,240 |
| 2022 | $5,224 | $280,320 | $52,480 | $227,840 |
| 2021 | $5,161 | $212,960 | $37,960 | $175,000 |
| 2020 | $5,205 | $207,080 | $42,560 | $164,520 |
| 2019 | $602 | $203,400 | $41,800 | $161,600 |
| 2018 | $5,912 | $198,640 | $40,840 | $157,800 |
| 2017 | $4,883 | $155,640 | $29,520 | $126,120 |
| 2016 | $4,805 | $155,640 | $29,520 | $126,120 |
| 2015 | $4,857 | $155,640 | $29,520 | $126,120 |
| 2014 | $5,029 | $155,640 | $29,520 | $126,120 |
Source: Public Records
Map
Nearby Homes
- 11835 Leeward Walk Cir
- 1895 Oak Tree Hollow
- 12205 Stevens Creek Dr
- 5200 Cresslyn Ridge
- 5575 Ashwind Trace
- 5455 Woodrun Ln
- 11615 Windbrooke Way
- 5610 N Hillbrooke Trace
- 5325 Hillgate Crossing
- 11575 Windbrooke Way Unit 2
- 5470 N Hillbrooke Trace
- 335 Dunhill Way Ct
- 440 Newport Heights
- 12470 Concord Hall Dr
- 5785 Oxborough Way Unit 1
- 110 W Meadows Ct
- 12340 Broadleaf Ln
- 115 Fallen Leaf Ct
- 12335 Broadleaf Ln
- 120 Fallen Leaf Ct
- 110 Fallen Leaf Ct
- 100 Fallen Leaf Ct
- 12325 Broadleaf Ln
- 12350 Broadleaf Ln
- 125 Fallen Leaf Ct
- 12345 Broadleaf Ln
- 130 Fallen Leaf Ct
- 12310 Broadleaf Ln
- 5365 Lexington Woods Ln
- 140 Fallen Leaf Ct
- 135 Fallen Leaf Ct
- 12315 Broadleaf Ln
- 5405 Lexington Woods Ln
- 5355 Lexington Woods Ln
- 12300 Broadleaf Ln
- 145 Fallen Leaf Ct