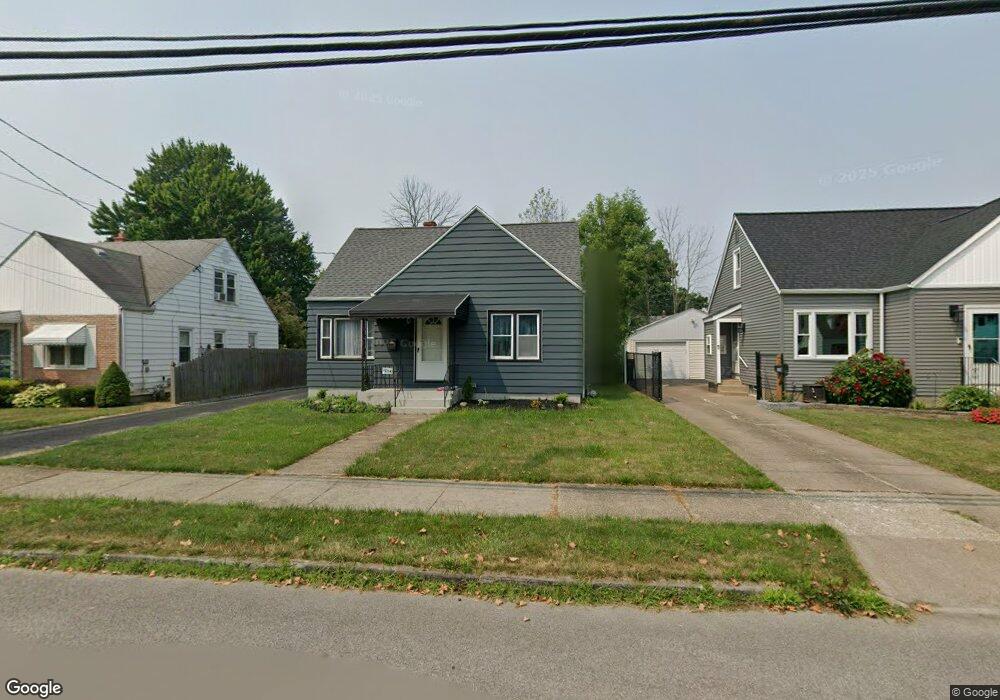
1234 89th St Niagara Falls, NY 14304
LaSalle NeighborhoodEstimated Value: $198,000 - $229,674
3
Beds
2
Baths
1,254
Sq Ft
$172/Sq Ft
Est. Value
About This Home
This home is located at 1234 89th St, Niagara Falls, NY 14304 and is currently estimated at $215,169, approximately $171 per square foot. 1234 89th St is a home located in Niagara County with nearby schools including Niagara Falls High School, Christ the King Preparatory Academy, and Catholic Academy Of Niagara Falls - Elementary.
Ownership History
Date
Name
Owned For
Owner Type
Purchase Details
Closed on
Sep 6, 2023
Sold by
Buffalo Group Llc
Bought by
Ferris Andrew
Current Estimated Value
Home Financials for this Owner
Home Financials are based on the most recent Mortgage that was taken out on this home.
Original Mortgage
$182,386
Outstanding Balance
$178,474
Interest Rate
6.9%
Mortgage Type
FHA
Estimated Equity
$36,695
Purchase Details
Closed on
Jul 19, 2022
Sold by
Oravec Ronald D
Bought by
Buffalo Group Llc
Home Financials for this Owner
Home Financials are based on the most recent Mortgage that was taken out on this home.
Original Mortgage
$60,000
Interest Rate
5.23%
Mortgage Type
Construction
Purchase Details
Closed on
Aug 14, 2000
Sold by
Hazel Eugene H Florence K
Bought by
Oravec Ronald D
Create a Home Valuation Report for This Property
The Home Valuation Report is an in-depth analysis detailing your home's value as well as a comparison with similar homes in the area
Home Values in the Area
Average Home Value in this Area
Purchase History
| Date | Buyer | Sale Price | Title Company |
|---|---|---|---|
| Ferris Andrew | $188,000 | None Listed On Document | |
| Buffalo Group Llc | $75,000 | Chicago Title | |
| Oravec Ronald D | $57,900 | -- |
Source: Public Records
Mortgage History
| Date | Status | Borrower | Loan Amount |
|---|---|---|---|
| Open | Ferris Andrew | $182,386 | |
| Previous Owner | Buffalo Group Llc | $60,000 |
Source: Public Records
Tax History Compared to Growth
Tax History
| Year | Tax Paid | Tax Assessment Tax Assessment Total Assessment is a certain percentage of the fair market value that is determined by local assessors to be the total taxable value of land and additions on the property. | Land | Improvement |
|---|---|---|---|---|
| 2024 | $4,779 | $76,000 | $5,300 | $70,700 |
| 2023 | $3,138 | $76,000 | $5,300 | $70,700 |
| 2022 | $2,223 | $76,000 | $5,300 | $70,700 |
| 2021 | $2,223 | $76,000 | $5,300 | $70,700 |
| 2020 | $1,475 | $76,000 | $5,300 | $70,700 |
| 2019 | $1,416 | $76,000 | $5,300 | $70,700 |
| 2018 | $2,184 | $76,000 | $5,300 | $70,700 |
| 2017 | $1,416 | $76,000 | $5,300 | $70,700 |
| 2016 | $2,123 | $76,000 | $5,300 | $70,700 |
| 2015 | -- | $76,000 | $5,300 | $70,700 |
| 2014 | -- | $76,000 | $5,300 | $70,700 |
Source: Public Records
Map
Nearby Homes