Estimated Value: $252,213 - $674,000
3
Beds
1
Bath
2,208
Sq Ft
$191/Sq Ft
Est. Value
About This Home
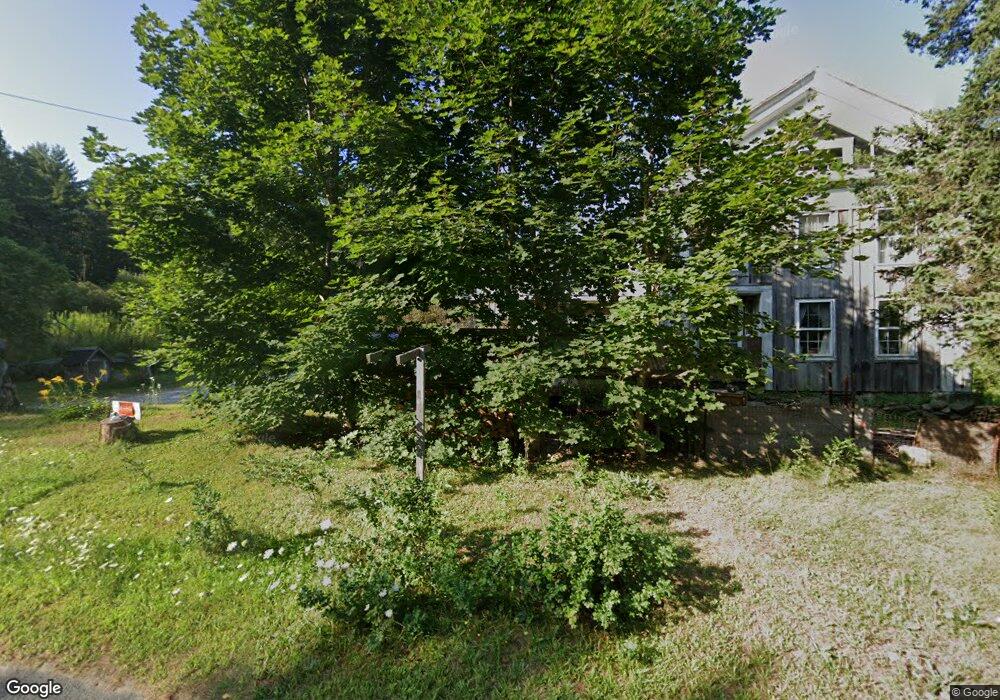
This home is located at 1234 E Otis Rd, Otis, MA 01253 and is currently estimated at $421,303, approximately $190 per square foot. 1234 E Otis Rd is a home with nearby schools including Farmington River Elementary School.
Ownership History
Date
Name
Owned For
Owner Type
Purchase Details
Closed on
Jul 29, 2025
Sold by
Adams Mary C
Bought by
1234 East Otis Road Re Nt and Adams
Current Estimated Value
Purchase Details
Closed on
Mar 17, 2000
Sold by
Trager Christopher B and Trager Vicki Ann
Bought by
Adams Mary C
Purchase Details
Closed on
Jul 28, 1997
Sold by
Fitzgerald John F and Fitzgerald Phyllis A
Bought by
Trager Christopher B and Drake Vicki Ann
Home Financials for this Owner
Home Financials are based on the most recent Mortgage that was taken out on this home.
Original Mortgage
$84,500
Interest Rate
7.7%
Mortgage Type
Purchase Money Mortgage
Create a Home Valuation Report for This Property
The Home Valuation Report is an in-depth analysis detailing your home's value as well as a comparison with similar homes in the area
Home Values in the Area
Average Home Value in this Area
Purchase History
| Date | Buyer | Sale Price | Title Company |
|---|---|---|---|
| 1234 East Otis Road Re Nt | -- | -- | |
| 1234 East Otis Road Re Nt | -- | -- | |
| Adams Mary C | $112,000 | -- | |
| Adams Mary C | $112,000 | -- | |
| Trager Christopher B | $89,000 | -- |
Source: Public Records
Mortgage History
| Date | Status | Borrower | Loan Amount |
|---|---|---|---|
| Previous Owner | Trager Christopher B | $84,500 |
Source: Public Records
Tax History Compared to Growth
Tax History
| Year | Tax Paid | Tax Assessment Tax Assessment Total Assessment is a certain percentage of the fair market value that is determined by local assessors to be the total taxable value of land and additions on the property. | Land | Improvement |
|---|---|---|---|---|
| 2025 | $1,074 | $166,300 | $47,700 | $118,600 |
| 2024 | $1,091 | $168,400 | $49,400 | $119,000 |
| 2023 | $1,040 | $157,100 | $38,100 | $119,000 |
| 2022 | $1,368 | $176,500 | $36,300 | $140,200 |
| 2021 | $1,237 | $146,100 | $36,300 | $109,800 |
| 2020 | $1,200 | $143,900 | $36,300 | $107,600 |
| 2019 | $1,191 | $143,900 | $36,300 | $107,600 |
| 2018 | $1,191 | $143,900 | $36,300 | $107,600 |
| 2017 | $1,163 | $143,900 | $36,300 | $107,600 |
| 2016 | $1,156 | $147,300 | $36,300 | $111,000 |
| 2015 | $1,227 | $163,000 | $37,600 | $125,400 |
Source: Public Records
Map
Nearby Homes