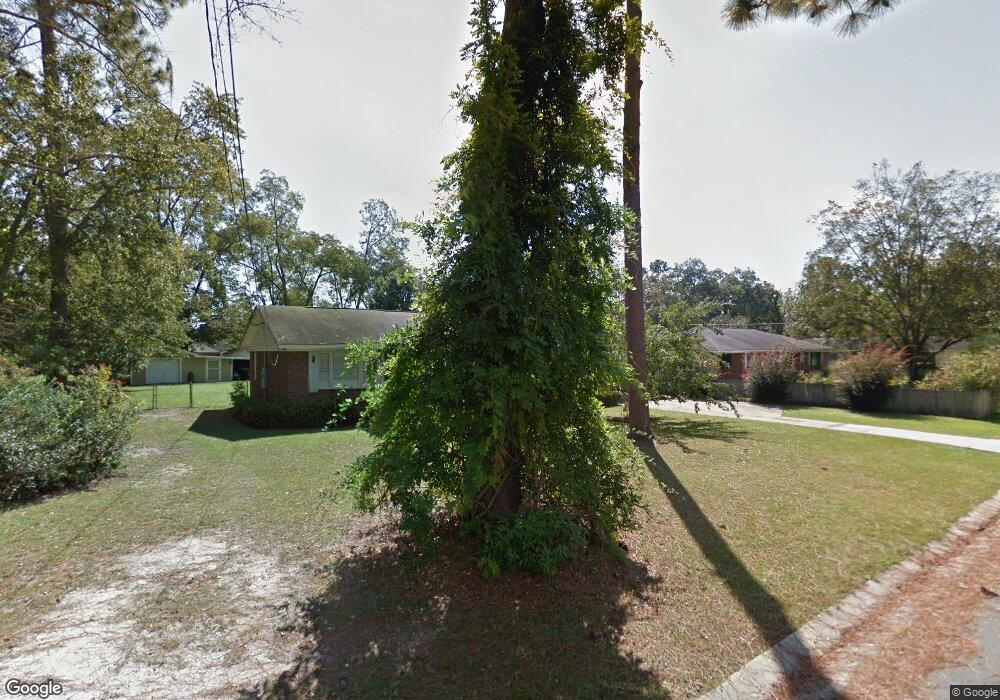
1234 Lake St Waycross, GA 31503
Estimated Value: $165,131 - $195,000
2
Beds
2
Baths
1,505
Sq Ft
$119/Sq Ft
Est. Value
About This Home
This home is located at 1234 Lake St, Waycross, GA 31503 and is currently estimated at $179,783, approximately $119 per square foot. 1234 Lake St is a home located in Ware County with nearby schools including Waresboro Elementary School, Ware County Middle School, and Ware County High School.
Ownership History
Date
Name
Owned For
Owner Type
Purchase Details
Closed on
Mar 31, 2022
Sold by
Callentani Shanon Michael
Bought by
Bush Rita Ann
Current Estimated Value
Home Financials for this Owner
Home Financials are based on the most recent Mortgage that was taken out on this home.
Original Mortgage
$139,820
Outstanding Balance
$130,871
Interest Rate
3.92%
Mortgage Type
FHA
Estimated Equity
$48,912
Purchase Details
Closed on
Jun 8, 2020
Sold by
Warren Kathy A
Bought by
Cellentani Shannon Michael
Home Financials for this Owner
Home Financials are based on the most recent Mortgage that was taken out on this home.
Original Mortgage
$99,661
Interest Rate
3.3%
Mortgage Type
FHA
Purchase Details
Closed on
Feb 27, 2002
Sold by
Fraley Randall E
Bought by
Warren Kathy
Purchase Details
Closed on
Sep 28, 1978
Create a Home Valuation Report for This Property
The Home Valuation Report is an in-depth analysis detailing your home's value as well as a comparison with similar homes in the area
Home Values in the Area
Average Home Value in this Area
Purchase History
| Date | Buyer | Sale Price | Title Company |
|---|---|---|---|
| Bush Rita Ann | $142,400 | -- | |
| Cellentani Shannon Michael | $101,500 | -- | |
| Warren Kathy | $58,000 | -- | |
| -- | -- | -- |
Source: Public Records
Mortgage History
| Date | Status | Borrower | Loan Amount |
|---|---|---|---|
| Open | Bush Rita Ann | $139,820 | |
| Previous Owner | Cellentani Shannon Michael | $99,661 |
Source: Public Records
Tax History Compared to Growth
Tax History
| Year | Tax Paid | Tax Assessment Tax Assessment Total Assessment is a certain percentage of the fair market value that is determined by local assessors to be the total taxable value of land and additions on the property. | Land | Improvement |
|---|---|---|---|---|
| 2024 | $1,713 | $69,881 | $7,560 | $62,321 |
| 2023 | $1,798 | $40,689 | $2,772 | $37,917 |
| 2022 | $1,175 | $40,689 | $2,772 | $37,917 |
| 2021 | $1,029 | $32,793 | $2,772 | $30,021 |
| 2020 | $772 | $31,744 | $2,772 | $28,972 |
| 2019 | $787 | $28,542 | $2,772 | $25,770 |
| 2018 | $777 | $27,509 | $2,772 | $24,737 |
| 2017 | $776 | $27,509 | $2,772 | $24,737 |
| 2016 | $776 | $27,509 | $2,772 | $24,737 |
| 2015 | $783 | $27,508 | $2,772 | $24,737 |
| 2014 | $782 | $27,509 | $2,772 | $24,737 |
| 2013 | -- | $27,508 | $2,772 | $24,736 |
Source: Public Records
Map
Nearby Homes
- 1261 Lake St
- 1210 N Augusta Ave
- 1300 Stanton Ave
- Lot 155 N Augusta Avenue Cherokee Ave
- 2066 Cherokee St
- 1238 Red Keen Rd
- 2117 Tamara Rd
- 1601 Genoa St
- 850 Woodard Ln
- 01 State St
- 02 State St
- 2836 Evergreen Rd
- 2885 Longwood Rd
- 2867 Evergreen Rd
- 3 Abc Ave
- 7 Abc Ave
- 6 Abc Ave
- 1 Abc Ave
- 4 Abc Ave
- 5 Abc Ave
- 1260 Lake St
- 1212 Lake St
- 905 N Augusta Ave
- 1288 Lake St
- 901 N Augusta Ave
- 1235 Lake St
- 2009 Ben Hill Ave
- 2100 Ben Hill Ave
- 913 N Augusta Ave
- 1287 Lake St
- 821 N Augusta Ave
- 2066 Lamar Ave
- 1150 Lake St
- 1001 N Augusta Ave
- 819 N Augusta Ave
- 1238 Cleveland St
- 1216 Cleveland St
- 1264 Cleveland St
- 1130 Lake St
- 914 N Augusta Ave