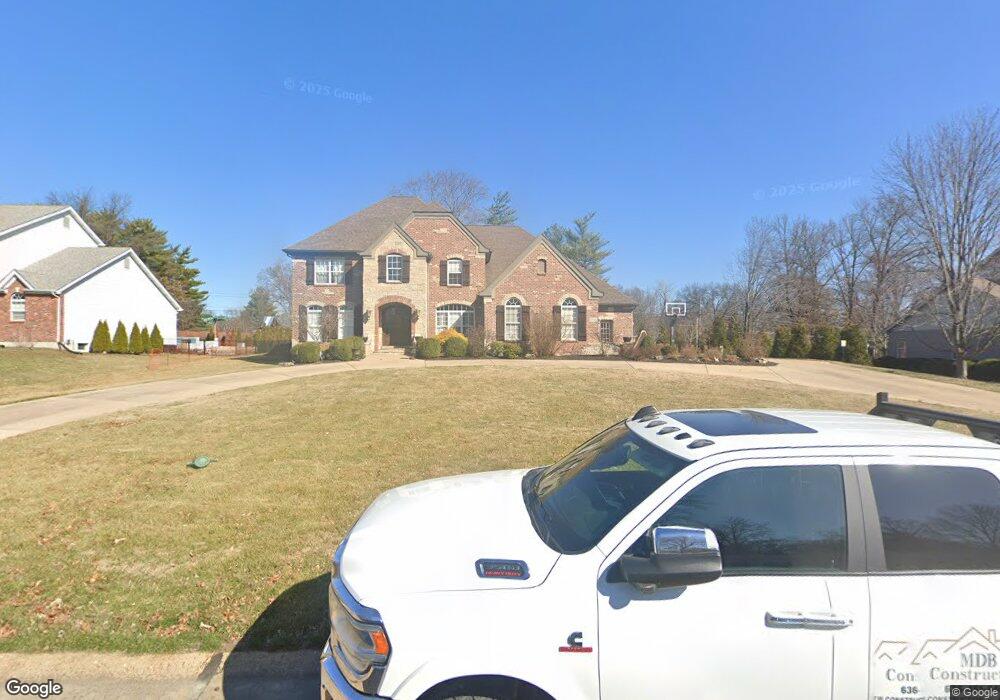
12345 Borcherding Ln Saint Louis, MO 63131
Estimated Value: $1,294,368 - $1,605,000
4
Beds
5
Baths
3,851
Sq Ft
$376/Sq Ft
Est. Value
About This Home
This home is located at 12345 Borcherding Ln, Saint Louis, MO 63131 and is currently estimated at $1,446,342, approximately $375 per square foot. 12345 Borcherding Ln is a home located in St. Louis County with nearby schools including Westchester Elementary School, North Kirkwood Middle School, and Kirkwood Senior High School.
Ownership History
Date
Name
Owned For
Owner Type
Purchase Details
Closed on
May 27, 2009
Sold by
D A Randolph Llc
Bought by
Forsberg Michael and Rampersad Roxane
Current Estimated Value
Home Financials for this Owner
Home Financials are based on the most recent Mortgage that was taken out on this home.
Original Mortgage
$750,500
Outstanding Balance
$470,855
Interest Rate
4.72%
Mortgage Type
Purchase Money Mortgage
Estimated Equity
$975,487
Purchase Details
Closed on
Jul 10, 2007
Sold by
The Raymond C & Violet E Borcherding Joi
Bought by
D A Randolph Llc
Home Financials for this Owner
Home Financials are based on the most recent Mortgage that was taken out on this home.
Original Mortgage
$700,000
Interest Rate
6.41%
Mortgage Type
Purchase Money Mortgage
Create a Home Valuation Report for This Property
The Home Valuation Report is an in-depth analysis detailing your home's value as well as a comparison with similar homes in the area
Home Values in the Area
Average Home Value in this Area
Purchase History
| Date | Buyer | Sale Price | Title Company |
|---|---|---|---|
| Forsberg Michael | $790,000 | None Available | |
| D A Randolph Llc | $360,000 | None Available |
Source: Public Records
Mortgage History
| Date | Status | Borrower | Loan Amount |
|---|---|---|---|
| Open | Forsberg Michael | $750,500 | |
| Previous Owner | D A Randolph Llc | $700,000 |
Source: Public Records
Tax History Compared to Growth
Tax History
| Year | Tax Paid | Tax Assessment Tax Assessment Total Assessment is a certain percentage of the fair market value that is determined by local assessors to be the total taxable value of land and additions on the property. | Land | Improvement |
|---|---|---|---|---|
| 2025 | $11,472 | $230,240 | $76,570 | $153,670 |
| 2024 | $11,472 | $198,730 | $62,210 | $136,520 |
| 2023 | $11,294 | $198,730 | $62,210 | $136,520 |
| 2022 | $10,809 | $177,270 | $62,210 | $115,060 |
| 2021 | $10,692 | $177,270 | $62,210 | $115,060 |
| 2020 | $9,363 | $149,190 | $35,020 | $114,170 |
| 2019 | $9,375 | $149,190 | $35,020 | $114,170 |
| 2018 | $11,322 | $161,760 | $28,230 | $133,530 |
| 2017 | $10,448 | $148,840 | $28,230 | $120,610 |
| 2016 | $10,215 | $147,400 | $28,230 | $119,170 |
| 2015 | $10,227 | $147,400 | $28,230 | $119,170 |
| 2014 | $10,329 | $145,500 | $25,000 | $120,500 |
Source: Public Records
Map
Nearby Homes
- 12439 Springdale Ln Unit TBB
- The Hawthorne Plan at Ballas Ridge
- The Roclare II Plan at Ballas Ridge
- The Westchester IV Plan at Ballas Ridge
- The Nottingham II Plan at Ballas Ridge
- The Hawthorne II Plan at Ballas Ridge
- TBB
- TBB Ballas Ridge Roclare II
- TBB Ballas Ridge Hawthorne II
- TBB Ballas Ridge Westchester IV
- TBB
- 2056 N Ballas Rd
- 2062 N Ballas Rd
- 8 Briarbrook Trail
- 0 Unknown Unit 22071090
- 1090 Kinstern Dr
- 1029 Kinstern Dr
- 918 N Ballas Rd
- 1728 Folkstone Dr
- 1126 Bopp Rd
- 12349 Borcherding Ln
- 12339 Borcherding Ln
- 12370 Ironstone Rd
- 12384 Ironstone Rd
- 12342 Borcherding Ln
- 12348 Borcherding Ln
- 12358 Ironstone Rd
- 12336 Borcherding Ln
- 12333 Borcherding Ln
- 12371 Creekhaven Dr
- 12346 Ironstone Rd
- 12385 Creekhaven Dr
- 12385 Ironstone Rd
- 12359 Ironstone Rd
- 12355 Creekhaven Dr
- 12330 Borcherding Ln
- 1837 N Ballas Rd
- 1843 N Ballas Rd
- 12327 Borcherding Ln
- 1849 N Ballas Rd