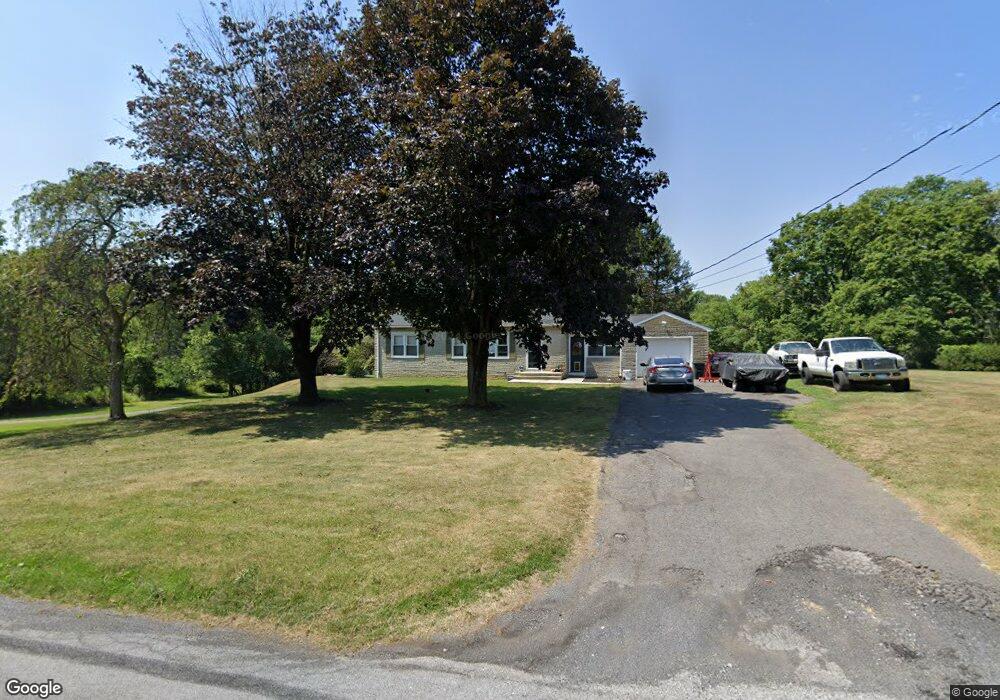
12348 Walnut Point W Hagerstown, MD 21740
Wilson-Conococheague NeighborhoodEstimated Value: $307,284 - $328,000
3
Beds
1
Bath
1,076
Sq Ft
$297/Sq Ft
Est. Value
About This Home
This home is located at 12348 Walnut Point W, Hagerstown, MD 21740 and is currently estimated at $319,071, approximately $296 per square foot. 12348 Walnut Point W is a home located in Washington County with nearby schools including Jonathan Hager Elementary School, Clear Spring Middle School, and Clear Spring High School.
Ownership History
Date
Name
Owned For
Owner Type
Purchase Details
Closed on
Aug 4, 2020
Sold by
Anderson Chad E
Bought by
Haley Travis A and Singleton Brooke R
Current Estimated Value
Home Financials for this Owner
Home Financials are based on the most recent Mortgage that was taken out on this home.
Original Mortgage
$206,565
Outstanding Balance
$183,238
Interest Rate
3%
Mortgage Type
New Conventional
Estimated Equity
$135,833
Purchase Details
Closed on
Dec 30, 2009
Sold by
Mccraith Steven G
Bought by
Anderson Chad E
Purchase Details
Closed on
Jul 3, 2003
Sold by
Gann Richard C and Gann Sheila A
Bought by
Mccraith Steven G
Purchase Details
Closed on
Apr 1, 1996
Sold by
Burger Charles S
Bought by
Gann Richard C and Gann Sheila A
Purchase Details
Closed on
Nov 17, 1995
Sold by
Burger Charles S
Bought by
Albert Eugene S
Create a Home Valuation Report for This Property
The Home Valuation Report is an in-depth analysis detailing your home's value as well as a comparison with similar homes in the area
Home Values in the Area
Average Home Value in this Area
Purchase History
| Date | Buyer | Sale Price | Title Company |
|---|---|---|---|
| Haley Travis A | $204,500 | Lawyers Singnature Settlemen | |
| Anderson Chad E | $169,900 | -- | |
| Mccraith Steven G | $140,000 | -- | |
| Gann Richard C | $90,000 | -- | |
| Albert Eugene S | $19,000 | -- |
Source: Public Records
Mortgage History
| Date | Status | Borrower | Loan Amount |
|---|---|---|---|
| Open | Haley Travis A | $206,565 | |
| Closed | Anderson Chad E | -- |
Source: Public Records
Tax History Compared to Growth
Tax History
| Year | Tax Paid | Tax Assessment Tax Assessment Total Assessment is a certain percentage of the fair market value that is determined by local assessors to be the total taxable value of land and additions on the property. | Land | Improvement |
|---|---|---|---|---|
| 2025 | $2,321 | $242,033 | $0 | $0 |
| 2024 | $2,321 | $218,367 | $0 | $0 |
| 2023 | $2,076 | $194,700 | $45,000 | $149,700 |
| 2022 | $1,836 | $171,567 | $0 | $0 |
| 2021 | $1,626 | $148,433 | $0 | $0 |
| 2020 | $1,382 | $125,300 | $45,000 | $80,300 |
| 2019 | $1,388 | $125,300 | $45,000 | $80,300 |
| 2018 | $1,387 | $125,300 | $45,000 | $80,300 |
| 2017 | $1,541 | $143,100 | $0 | $0 |
| 2016 | -- | $139,733 | $0 | $0 |
| 2015 | $1,701 | $136,367 | $0 | $0 |
| 2014 | $1,701 | $133,000 | $0 | $0 |
Source: Public Records
Map
Nearby Homes
- 15534 National Pike
- 15149 Bloyers Ave
- 12810 Kending Ln
- 11819 White Pine Dr
- 12401 Cedar Ridge Rd
- 15939 Hosta Dr
- 12074 Kemps Mill Rd
- 11905 Heather Dr
- 11701 Walnut Point Rd
- 16512 National Pike
- 14924 Clear Spring Rd
- 12720 Spickler Rd
- 14906 Clear Spring Rd
- 14910 Clear Spring Rd
- 13039 Spickler Rd
- 13224 Greencastle Pike
- 13726 Hopps Landing Rd
- 16802 Alcott Rd
- 16847 Longfellow Ct
- 16810 Alcott Rd
- 12348 Walnut Point W
- 12404 Walnut Point W
- 12345 Walnut Point W
- 12338 Walnut Point W
- 12346 Walnut Point W
- 12346 Walnut Point W
- 12335 Walnut Point W
- 12334 Walnut Point W
- 12418 Walnut Point W
- 12331 Walnut Point W
- 12408 Walnut Point W
- 12328 Walnut Point W
- 15640 Deer Lodge Cir
- 15637 Deer Lodge Cir
- 15604 Deer Lodge Cir
- 12324 Walnut Point W
- 12422 Walnut Point W
- 12325 Walnut Point W
- 12423 Walnut Point W
- 12426 Walnut Point W